एसआईपी में जोखिम: एसआईपी निवेश में जोखिम का आकलन
में जोखिमसिप भिन्न के लिए भिन्न होता हैम्यूचुअल फंड के प्रकार.म्यूचुअल फंड में निवेश एसआईपी के माध्यम से (व्यवस्थितनिवेश योजना) शामिल हैमंडी जुड़े जोखिम, जो निश्चित रूप से अधिक हैंइक्विटी फ़ंड ऋण और संतुलित की तुलना मेंम्यूचुअल फंड्स. एसआईपी में जोखिम उस निवेश विकल्प पर निर्भर करता है जिसे को देखते हुए चुना जाता हैजोखिम प्रोफाइल, जोखिम की भूख औरलिक्विडिटी. हालांकि, एसआईपी में जोखिम को फंड मैनेजर और फंड हाउस द्वारा प्रबंधित और कम किया जा सकता है।
एसआईपी में जोखिम की गणना करने के लिए विभिन्न उपकरण उपलब्ध हैं जैसेघूंट कैलकुलेटर (एसआईपी रिटर्न कैलकुलेटर के रूप में भी जाना जाता है)।
एसआईपी में जोखिम: एसआईपी जोखिमों का आकलन
जोखिम 1: एसआईपी के नकारात्मक रिटर्न या मूल्य जोखिम मिलने का जोखिम
म्युचुअल फंड निवेश बाजार के जोखिमों के अधीन हैं, यह आमतौर पर सुना जाने वाला शब्द है। इसका मतलब यह है कि एसआईपी में आपका निवेश कम हो सकता है और बाजार के व्यवहार के आधार पर आप जितना निवेश करते हैं, उससे कम मूल्य के साथ समाप्त हो सकते हैं।
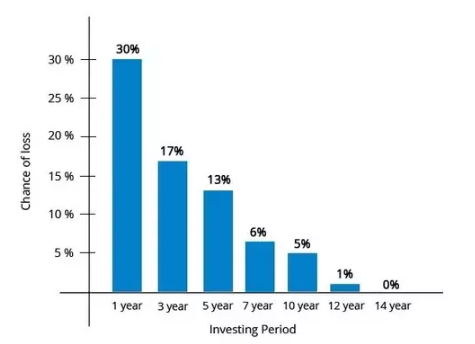
हालांकि एसआईपी में जोखिम होल्डिंग अवधि से संबंधित होता है और आमतौर पर होल्डिंग अवधि जितनी लंबी होती है, जोखिम उतना ही कम होता है। उच्च धारण अवधि के साथ लाभ कमाने की संभावना बढ़ जाती है। उदाहरण के लिए इक्विटी के लिए नीचे देखें, इक्विटी के लिए लंबी होल्डिंग अवधि के परिणामस्वरूप नुकसान की संभावना कम होती है। (नीचे 1979 से 2016 तक बीएसई सेंसेक्स पर किया गया विश्लेषण है)।
जोखिम 2: आपके पैसे को जल्दी से वापस पाने में सक्षम होने का जोखिम या तरलता जोखिम
आपका पैसा जल्दी वापस पाने की क्षमता इस पर निर्भर करती है:आधारभूत निवेश। आम तौर पर म्यूचुअल फंड के साथ, यह कोई मुद्दा नहीं है, हालांकि, कुछ अवधि (जैसे 2008 में) रही है, जब प्रतिभूतियों को बेचने में कोई समस्या थी (बांड) और कुछ म्यूचुअल फंडों को कुछ योजनाओं से निकासी को सीमित करना पड़ा। इक्विटी बाजार काफी तरल है (जिसका अर्थ है कि खरीदना और बेचना कोई समस्या नहीं है)। हालांकि, अगर बिक्री की मात्रा बड़ी मात्रा में खरीदारों की संख्या से अधिक हो जाती है, तो इसके परिणामस्वरूप एक समस्या होगी, इसलिए बाद में भुगतान एक समस्या बन जाएगी और इसलिए तरलता जोखिम।
जोखिम 3: किसी सुरक्षा या क्रेडिट जोखिम के डाउनग्रेड होने का जोखिम
जब किसी विशेष कंपनी/इकाई के बांड को क्रेडिट रेटिंग एजेंसी द्वारा डाउनग्रेड किया जाता है, तो इसकी कीमत गिर जाती है। अगर कीमत गिरती है, तो यह पोर्टफोलियो के समग्र मूल्य को प्रभावित करता है। इसे क्रेडिट रिस्क कहते हैं।
Talk to our investment specialist
जोखिम 4: कंपनी द्वारा बांड के मालिकों को उनके देय या डिफ़ॉल्ट जोखिम का भुगतान नहीं करने का जोखिम
जब कोई कंपनी बांड धारकों को अपने भुगतान में चूक करती है, तो इसे कहा जाता हैभुगतान में चूक की जोखिम.
साथइन्वेस्टर उनका पैसा वापस नहीं मिलने से उनके पोर्टफोलियो पर नकारात्मक असर पड़ेगा।
जोखिम 5: आपके लेन-देन को सही ढंग से संसाधित करने का जोखिम या तकनीकी जोखिम
आज, सभी लेनदेन इलेक्ट्रॉनिक मोड में होते हैं। विभिन्न स्पर्श-बिंदुओं के साथ, आर एंड टी एजेंट में विभिन्न स्थानों पर तकनीकी विफलता की संभावना है,बैंक धन आदि डेबिट करने के लिए
लेनदेन का गैर-प्रसंस्करण भी एसआईपी में एक जोखिम है।
जोखिम 6: पोर्टफोलियो प्रबंधक या फंड प्रबंधन जोखिम द्वारा योजना के प्रदर्शन का जोखिम

एसआईपी में एक और जोखिम यह है कि चुनी गई योजना उम्मीदों पर खरी नहीं उतरती है, और प्रदर्शन उम्मीद से बहुत कम हो सकता है। फंड मैनेजर प्रदर्शन पर कम डिलीवर कर सकता है, और इससे कम रिटर्न मिलेगाएसआईपी निवेश.
एसआईपी में ये प्रमुख जोखिम हैं, जबकि हम आगे बढ़ सकते हैं और एसआईपी में आगे के जोखिमों को विस्तृत कर सकते हैं जैसे:अर्थव्यवस्था जोखिम आदि, इनमें से अधिकतर जोखिम उपरोक्त श्रेणियों में से एक या अधिक के अंतर्गत आते हैं।
हालांकि एसआईपी में निश्चित रूप से एक जोखिम है, किसी को हमेशा याद रखना चाहिए कि एसआईपी या एकमुश्त, यह सिर्फ एक निवेश मार्ग है न कि अंतर्निहित निवेश। किसी को अंतर्निहित निवेश, उसके जोखिमों को देखने और फिर अंतिम निर्णय लेने की आवश्यकता है।
*नीचे दी गई सूची हैशीर्ष एसआईपीमें निवेश करने के लिए कोई मूल्यांकन कर सकता है "The primary investment objective of the Scheme is to seek capital appreciation by investing predominantly in units of MLIIF - WGF. The Scheme may, at the discretion of the Investment Manager, also invest in the units of other similar overseas mutual fund schemes, which may constitute a significant part of its corpus. The Scheme may also invest a certain portion of its corpus in money market securities and/or units of money market/liquid schemes of DSP Merrill Lynch Mutual Fund, in order to meet liquidity requirements from time to time. However, there is no assurance that the investment objective of the Scheme will be realized." Below is the key information for DSP World Gold Fund Returns up to 1 year are on The primary investment objective of the Scheme is to seek capital appreciation by investing predominantly in units of BGF – USFEF. The Scheme may, at the discretion of the Investment Manager also invest in the units of other similar overseas mutual fund schemes, which may constitute a significant part of its corpus. The Scheme may also invest a certain portion of its corpus in money market securities and/or money market/liquid schemes of DSP BlackRock Mutual Fund, in order to meet liquidity requirements from time to time. However, there is no assurance that the investment objective of the Scheme will be realized. It shall be noted ‘similar overseas mutual fund schemes’ shall have investment objective, investment strategy and risk profile/consideration similar to those of BGF – USFEF. Research Highlights for DSP US Flexible Equity Fund Below is the key information for DSP US Flexible Equity Fund Returns up to 1 year are on The primary investment objective of the Scheme is to seek to provide long term capital growth by investing predominantly in the JPMorgan Funds - Emerging Markets Opportunities Fund, an equity fund which invests primarily in an aggressively managed portfolio of emerging market companies Research Highlights for Edelweiss Emerging Markets Opportunities Equity Off-shore Fund Below is the key information for Edelweiss Emerging Markets Opportunities Equity Off-shore Fund Returns up to 1 year are on The investment objective of the scheme is to provide long term growth from a portfolio of equity / equity related instruments of companies engaged either directly or indirectly in the infrastructure sector. Research Highlights for LIC MF Infrastructure Fund Below is the key information for LIC MF Infrastructure Fund Returns up to 1 year are on (Erstwhile UTI Pharma & Healthcare Fund) The Investment objective of the Scheme is capital appreciation through investments in equities and equity related instruments of the Pharma & Healthcare sectors. Research Highlights for UTI Healthcare Fund Below is the key information for UTI Healthcare Fund Returns up to 1 year are on 1. DSP World Gold Fund
DSP World Gold Fund
Growth Launch Date 14 Sep 07 NAV (21 Jul 26) ₹48.8587 ↑ 1.27 (2.67 %) Net Assets (Cr) ₹1,433 on 30 Jun 26 Category Equity - Global AMC DSP BlackRock Invmt Managers Pvt. Ltd. Rating ☆☆☆ Risk High Expense Ratio 1.41 Sharpe Ratio 1.22 Information Ratio -0.5 Alpha Ratio 2.12 Min Investment 1,000 Min SIP Investment 500 Exit Load 0-12 Months (1%),12 Months and above(NIL) Growth of 10,000 investment over the years.
Date Value Returns for DSP World Gold Fund
absolute basis & more than 1 year are on CAGR (Compound Annual Growth Rate) basis. as on 21 Jul 26 Duration Returns 1 Month -13.5% 3 Month -25.1% 6 Month -23.7% 1 Year 58.4% 3 Year 38.9% 5 Year 21.6% 10 Year 15 Year Since launch 8.6% Historical performance (Yearly) on absolute basis
Year Returns 2024 167.1% 2023 15.9% 2022 7% 2021 -7.7% 2020 -9% 2019 31.4% 2018 35.1% 2017 -10.7% 2016 -4% 2015 52.7% Fund Manager information for DSP World Gold Fund
Name Since Tenure Data below for DSP World Gold Fund as on 30 Jun 26
Equity Sector Allocation
Sector Value Asset Allocation
Asset Class Value Top Securities Holdings / Portfolio
Name Holding Value Quantity 2. DSP US Flexible Equity Fund
DSP US Flexible Equity Fund
Growth Launch Date 3 Aug 12 NAV (21 Jul 26) ₹93.0913 ↑ 0.35 (0.37 %) Net Assets (Cr) ₹1,291 on 30 Jun 26 Category Equity - Global AMC DSP BlackRock Invmt Managers Pvt. Ltd. Rating ☆☆☆☆☆ Risk High Expense Ratio 1.55 Sharpe Ratio 1.93 Information Ratio 0.15 Alpha Ratio -4.1 Min Investment 1,000 Min SIP Investment 500 Exit Load 0-12 Months (1%),12 Months and above(NIL) Growth of 10,000 investment over the years.
Date Value Returns for DSP US Flexible Equity Fund
absolute basis & more than 1 year are on CAGR (Compound Annual Growth Rate) basis. as on 21 Jul 26 Duration Returns 1 Month -0.4% 3 Month 8.6% 6 Month 18.1% 1 Year 45% 3 Year 26% 5 Year 18.3% 10 Year 15 Year Since launch 17.3% Historical performance (Yearly) on absolute basis
Year Returns 2024 33.8% 2023 17.8% 2022 22% 2021 -5.9% 2020 24.2% 2019 22.6% 2018 27.5% 2017 -1.1% 2016 15.5% 2015 9.8% Fund Manager information for DSP US Flexible Equity Fund
Name Since Tenure Data below for DSP US Flexible Equity Fund as on 30 Jun 26
Equity Sector Allocation
Sector Value Asset Allocation
Asset Class Value Top Securities Holdings / Portfolio
Name Holding Value Quantity 3. Edelweiss Emerging Markets Opportunities Equity Off-shore Fund
Edelweiss Emerging Markets Opportunities Equity Off-shore Fund
Growth Launch Date 7 Jul 14 NAV (21 Jul 26) ₹28.0113 ↑ 0.50 (1.81 %) Net Assets (Cr) ₹259 on 30 Jun 26 Category Equity - Global AMC Edelweiss Asset Management Limited Rating ☆☆☆ Risk High Expense Ratio 1.04 Sharpe Ratio 2.2 Information Ratio -0.41 Alpha Ratio 6.3 Min Investment 5,000 Min SIP Investment 1,000 Exit Load 0-1 Years (1%),1 Years and above(NIL) Growth of 10,000 investment over the years.
Date Value Returns for Edelweiss Emerging Markets Opportunities Equity Off-shore Fund
absolute basis & more than 1 year are on CAGR (Compound Annual Growth Rate) basis. as on 21 Jul 26 Duration Returns 1 Month -4.8% 3 Month 6.5% 6 Month 22.9% 1 Year 59.9% 3 Year 25.8% 5 Year 10% 10 Year 15 Year Since launch 8.9% Historical performance (Yearly) on absolute basis
Year Returns 2024 41.1% 2023 5.9% 2022 5.5% 2021 -16.8% 2020 -5.9% 2019 21.7% 2018 25.1% 2017 -7.2% 2016 30% 2015 9.8% Fund Manager information for Edelweiss Emerging Markets Opportunities Equity Off-shore Fund
Name Since Tenure Data below for Edelweiss Emerging Markets Opportunities Equity Off-shore Fund as on 30 Jun 26
Equity Sector Allocation
Sector Value Asset Allocation
Asset Class Value Top Securities Holdings / Portfolio
Name Holding Value Quantity 4. LIC MF Infrastructure Fund
LIC MF Infrastructure Fund
Growth Launch Date 29 Feb 08 NAV (22 Jul 26) ₹53.8358 ↓ -0.59 (-1.09 %) Net Assets (Cr) ₹1,137 on 30 Jun 26 Category Equity - Sectoral AMC LIC Mutual Fund Asset Mgmt Co Ltd Rating Risk High Expense Ratio 2.21 Sharpe Ratio 0.22 Information Ratio 0.58 Alpha Ratio 8.41 Min Investment 5,000 Min SIP Investment 1,000 Exit Load 0-1 Years (1%),1 Years and above(NIL) Growth of 10,000 investment over the years.
Date Value Returns for LIC MF Infrastructure Fund
absolute basis & more than 1 year are on CAGR (Compound Annual Growth Rate) basis. as on 21 Jul 26 Duration Returns 1 Month -3.5% 3 Month 4.2% 6 Month 15.6% 1 Year 6.4% 3 Year 25.1% 5 Year 22.4% 10 Year 15 Year Since launch 9.6% Historical performance (Yearly) on absolute basis
Year Returns 2024 -3.7% 2023 47.8% 2022 44.4% 2021 7.9% 2020 46.6% 2019 -0.1% 2018 13.3% 2017 -14.6% 2016 42.2% 2015 -2.2% Fund Manager information for LIC MF Infrastructure Fund
Name Since Tenure Data below for LIC MF Infrastructure Fund as on 30 Jun 26
Equity Sector Allocation
Sector Value Asset Allocation
Asset Class Value Top Securities Holdings / Portfolio
Name Holding Value Quantity 5. UTI Healthcare Fund
UTI Healthcare Fund
Growth Launch Date 28 Jun 99 NAV (22 Jul 26) ₹328.776 ↓ -5.28 (-1.58 %) Net Assets (Cr) ₹1,308 on 30 Jun 26 Category Equity - Sectoral AMC UTI Asset Management Company Ltd Rating ☆ Risk High Expense Ratio 2.26 Sharpe Ratio 0.58 Information Ratio 0.2 Alpha Ratio 2.15 Min Investment 5,000 Min SIP Investment 500 Exit Load 0-1 Years (1%),1 Years and above(NIL) Growth of 10,000 investment over the years.
Date Value Returns for UTI Healthcare Fund
absolute basis & more than 1 year are on CAGR (Compound Annual Growth Rate) basis. as on 21 Jul 26 Duration Returns 1 Month 3.3% 3 Month 15% 6 Month 20.9% 1 Year 12.1% 3 Year 24.4% 5 Year 14.1% 10 Year 15 Year Since launch 15% Historical performance (Yearly) on absolute basis
Year Returns 2024 -3.1% 2023 42.9% 2022 38.2% 2021 -12.3% 2020 19.1% 2019 67.4% 2018 1.2% 2017 -7.5% 2016 6.2% 2015 -9.7% Fund Manager information for UTI Healthcare Fund
Name Since Tenure Data below for UTI Healthcare Fund as on 30 Jun 26
Equity Sector Allocation
Sector Value Asset Allocation
Asset Class Value Top Securities Holdings / Portfolio
Name Holding Value Quantity
यहां प्रदान की गई जानकारी सटीक है, यह सुनिश्चित करने के लिए सभी प्रयास किए गए हैं। हालांकि, डेटा की शुद्धता के संबंध में कोई गारंटी नहीं दी जाती है। कृपया कोई भी निवेश करने से पहले योजना सूचना दस्तावेज के साथ सत्यापित करें।


AMFI Registration No. 112358 | CIN: U74999MH2016PTC282153
Shepard Technologies Pvt. Ltd. (with ARN code 112358) makes no warranties or representations, express or implied, on products offered through the platform. It accepts no liability for any damages or losses, however caused, in connection with the use of, or on the reliance of its product or related services. Terms and conditions of the website are applicable.
©2026 Shepard Technologies Private Limited. All Rights Reserved
Research Highlights for DSP World Gold Fund