Best Balanced Mutual Funds 2026
Top Balanced Fund are Mutual Funds that invest their assets in both equities and debt instrument to yield good overall returns. Balanced Mutual Funds are beneficial for investors who are willing to take a market risk while looking for some fixed returns as well.
The assets invested in equities and stocks offer market-linked returns while the assets invested in debt instruments offer fixed returns. Being a combination of both Equity and Debt, investors should be very careful when Investing in these funds. The investors are advised to look for top Balanced Funds before investing in Balanced Mutual Funds. We have listed top balanced mutual funds below.
Why Invest in Balanced Mutual Funds?
Generally, investors look for ways to diversify their investments within a shorter time period with less risk. Being a combination of both equity and debt instruments, balanced mutual funds offer best of both these worlds. So, these funds reduce the risk of downfall due to the constantly changing market conditions while managing some basic returns due to the debt exposure. This makes balanced funds a highly suitable investment option for investors looking for a mid-path of getting returns with slightly lower risk than investing in 100% Equity Funds.
Advantages & Disadvantages of Balanced Funds
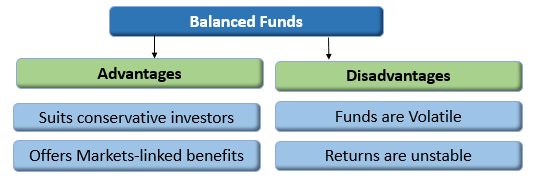
Advantages
- Provides stable returns by investing 35-40% of the assets in fixed income options
- Offers market-linked returns as swell by investing 60-65% of the assets in equities
- Suitable for conservative investors willing to take moderate risk
Disadvantages
- The funds invested in equities are volatile and have a high-risk factor
- The combined returns (returns of both debt and equity mutual funds) may not yield very good returns in the long run
Talk to our investment specialist
Best Performing Balanced Funds FY 26 - 27
Fund Selection Methodology used to find 5 funds
Top Performing Aggressive Hybrid Funds
This fund will invest around 65 to 85 percent of its total assets in equity-related instruments and about 20 to 35 percent of their assets in debt instruments. Mutual Fund Houses can offer either a balanced hybrid or an aggressive hybrid fund, not both.
Fund NAV Net Assets (Cr) 3 MO (%) 6 MO (%) 1 YR (%) 3 YR (%) 5 YR (%) 2025 (%) BOI AXA Mid and Small Cap Equity and Debt Fund Growth ₹41.9
↑ 0.36 ₹1,482 9.3 10.8 8.3 18.9 14.8 -0.9 Sundaram Equity Hybrid Fund Growth ₹135.137
↑ 0.78 ₹1,954 0.5 10.5 27.1 16 14.2 ICICI Prudential Equity and Debt Fund Growth ₹407.73
↑ 3.01 ₹50,033 2.6 0.1 3.7 15.9 16.8 13.3 IDBI Hybrid Equity Fund Growth ₹17.1253
↓ -0.01 ₹179 7.8 9.8 12.1 14.4 7.1 Bandhan Hybrid Equity Fund Growth ₹27.686
↑ 0.26 ₹2,021 5.7 3.7 7.1 14.3 12 7.7 Note: Returns up to 1 year are on absolute basis & more than 1 year are on CAGR basis. as on 10 Jul 26 Research Highlights & Commentary of 5 Funds showcased
Commentary BOI AXA Mid and Small Cap Equity and Debt Fund Sundaram Equity Hybrid Fund ICICI Prudential Equity and Debt Fund IDBI Hybrid Equity Fund Bandhan Hybrid Equity Fund Point 1 Bottom quartile AUM (₹1,482 Cr). Lower mid AUM (₹1,954 Cr). Highest AUM (₹50,033 Cr). Bottom quartile AUM (₹179 Cr). Upper mid AUM (₹2,021 Cr). Point 2 Established history (9+ yrs). Oldest track record among peers (26 yrs). Established history (26+ yrs). Established history (9+ yrs). Established history (9+ yrs). Point 3 Not Rated. Rating: 2★ (upper mid). Top rated. Not Rated. Not Rated. Point 4 Risk profile: Moderately High. Risk profile: Moderately High. Risk profile: Moderately High. Risk profile: Moderately High. Risk profile: Moderately High. Point 5 5Y return: 14.78% (upper mid). 5Y return: 14.20% (lower mid). 5Y return: 16.83% (top quartile). 5Y return: 7.09% (bottom quartile). 5Y return: 11.97% (bottom quartile). Point 6 3Y return: 18.88% (top quartile). 3Y return: 16.03% (upper mid). 3Y return: 15.88% (lower mid). 3Y return: 14.43% (bottom quartile). 3Y return: 14.31% (bottom quartile). Point 7 1Y return: 8.27% (lower mid). 1Y return: 27.10% (top quartile). 1Y return: 3.66% (bottom quartile). 1Y return: 12.06% (upper mid). 1Y return: 7.14% (bottom quartile). Point 8 1M return: 4.57% (upper mid). 1M return: 1.80% (bottom quartile). 1M return: 4.53% (lower mid). 1M return: 2.10% (bottom quartile). 1M return: 5.16% (top quartile). Point 9 Alpha: 0.00 (bottom quartile). Alpha: 5.81 (upper mid). Alpha: 1.75 (lower mid). Alpha: -0.26 (bottom quartile). Alpha: 6.12 (top quartile). Point 10 Sharpe: 0.50 (lower mid). Sharpe: 2.64 (top quartile). Sharpe: -0.21 (bottom quartile). Sharpe: 1.03 (upper mid). Sharpe: 0.08 (bottom quartile). BOI AXA Mid and Small Cap Equity and Debt Fund
Sundaram Equity Hybrid Fund
ICICI Prudential Equity and Debt Fund
IDBI Hybrid Equity Fund
Bandhan Hybrid Equity Fund
Top Performing Conservative Hybrid Funds
This scheme will majorly invested in debt instruments. About 75 to 90 percent of their total assets will be invest in debt instruments and about 10 to 25 percent in equity-related instruments. This scheme is named as conservative because it is for people who are risk-averse. Investors who don't want to take much risk in their investment can prefer investing in this scheme.
Fund NAV Net Assets (Cr) 3 MO (%) 6 MO (%) 1 YR (%) 3 YR (%) 5 YR (%) 2025 (%) ICICI Prudential MIP 25 Growth ₹79.3552
↑ 0.27 ₹3,302 2.6 2.2 4.7 9.1 8.6 7.9 SBI Debt Hybrid Fund Growth ₹76.5253
↑ 0.33 ₹9,793 3 3.2 4.9 8.9 8.8 6.7 DSP Regular Savings Fund Growth ₹61.0592
↑ 0.19 ₹179 2.7 1.7 3.6 8.8 7.3 7.2 Note: Returns up to 1 year are on absolute basis & more than 1 year are on CAGR basis. as on 10 Jul 26 Research Highlights & Commentary of 3 Funds showcased
Commentary ICICI Prudential MIP 25 SBI Debt Hybrid Fund DSP Regular Savings Fund Point 1 Lower mid AUM (₹3,302 Cr). Highest AUM (₹9,793 Cr). Bottom quartile AUM (₹179 Cr). Point 2 Established history (22+ yrs). Oldest track record among peers (25 yrs). Established history (22+ yrs). Point 3 Top rated. Rating: 5★ (lower mid). Rating: 3★ (bottom quartile). Point 4 Risk profile: Moderately High. Risk profile: Moderate. Risk profile: Moderately High. Point 5 5Y return: 8.64% (lower mid). 5Y return: 8.81% (upper mid). 5Y return: 7.35% (bottom quartile). Point 6 3Y return: 9.13% (upper mid). 3Y return: 8.91% (lower mid). 3Y return: 8.83% (bottom quartile). Point 7 1Y return: 4.66% (lower mid). 1Y return: 4.85% (upper mid). 1Y return: 3.62% (bottom quartile). Point 8 1M return: 1.98% (upper mid). 1M return: 1.68% (bottom quartile). 1M return: 1.70% (lower mid). Point 9 Alpha: 0.00 (lower mid). Alpha: 0.00 (bottom quartile). Alpha: 0.35 (upper mid). Point 10 Sharpe: -0.46 (lower mid). Sharpe: -0.22 (upper mid). Sharpe: -0.72 (bottom quartile). ICICI Prudential MIP 25
SBI Debt Hybrid Fund
DSP Regular Savings Fund
Top Performing Arbitrage Funds
This fund will follow the arbitrage strategy and will invest at least 65 percent of its assets in equity-related instruments. Arbitrage funds are Mutual Funds that leverage the differential price between the cash market and derivative market to generate mutual fund returns. The returns generated by arbitrage funds are dependent on the Volatility of the stock market. Arbitrage mutual funds are hybrid in nature and in times of high or persistent volatility, these funds offer relatively risk-free returns to investors.
Fund NAV Net Assets (Cr) 3 MO (%) 6 MO (%) 1 YR (%) 3 YR (%) 5 YR (%) 2025 (%) Invesco India Arbitrage Fund Growth ₹33.8893
↑ 0.01 ₹28,062 1.5 3 6 6.9 6.2 6.5 HDFC Arbitrage Fund Growth ₹32.525
↑ 0.01 ₹25,085 1.5 3 6 6.9 6 6.3 Kotak Equity Arbitrage Fund Growth ₹39.7825
↑ 0.01 ₹72,079 1.4 3 5.9 7 6.2 6.4 Note: Returns up to 1 year are on absolute basis & more than 1 year are on CAGR basis. as on 10 Jul 26 Research Highlights & Commentary of 3 Funds showcased
Commentary Invesco India Arbitrage Fund HDFC Arbitrage Fund Kotak Equity Arbitrage Fund Point 1 Lower mid AUM (₹28,062 Cr). Bottom quartile AUM (₹25,085 Cr). Highest AUM (₹72,079 Cr). Point 2 Established history (19+ yrs). Established history (18+ yrs). Oldest track record among peers (20 yrs). Point 3 Rating: 3★ (lower mid). Rating: 3★ (bottom quartile). Top rated. Point 4 Risk profile: Moderately Low. Risk profile: Moderately Low. Risk profile: Moderately Low. Point 5 5Y return: 6.25% (upper mid). 5Y return: 6.02% (bottom quartile). 5Y return: 6.22% (lower mid). Point 6 3Y return: 6.94% (lower mid). 3Y return: 6.90% (bottom quartile). 3Y return: 7.02% (upper mid). Point 7 1Y return: 6.01% (upper mid). 1Y return: 5.96% (lower mid). 1Y return: 5.93% (bottom quartile). Point 8 1M return: 0.54% (lower mid). 1M return: 0.55% (upper mid). 1M return: 0.51% (bottom quartile). Point 9 Alpha: 0.00 (upper mid). Alpha: 0.00 (lower mid). Alpha: 0.00 (bottom quartile). Point 10 Sharpe: -0.08 (upper mid). Sharpe: -0.24 (lower mid). Sharpe: -0.28 (bottom quartile). Invesco India Arbitrage Fund
HDFC Arbitrage Fund
Kotak Equity Arbitrage Fund
Top Performing Dynamic Asset Allocation Funds
This scheme would dynamically manage their investments in equity and debt instruments. These funds tend to increase the allocation to debt and reduce the weightage to equities when the market becomes costly. Also, these funds focus on providing stability at a low-risk.
Fund NAV Net Assets (Cr) 3 MO (%) 6 MO (%) 1 YR (%) 3 YR (%) 5 YR (%) 2025 (%) Franklin India Multi - Asset Solution Fund Growth ₹22.236
↑ 0.00 ₹136 1.7 3.1 5.8 12.9 10.9 14.1 Axis Dynamic Equity Fund Growth ₹21.54
↑ 0.15 ₹3,750 2.8 0.3 2.2 12 10 7 ICICI Prudential Balanced Advantage Fund Growth ₹78.05
↑ 0.52 ₹70,570 2.5 0.9 5.5 11.9 11 12.2 Note: Returns up to 1 year are on absolute basis & more than 1 year are on CAGR basis. as on 9 Jul 26 Research Highlights & Commentary of 3 Funds showcased
Commentary Franklin India Multi - Asset Solution Fund Axis Dynamic Equity Fund ICICI Prudential Balanced Advantage Fund Point 1 Bottom quartile AUM (₹136 Cr). Lower mid AUM (₹3,750 Cr). Highest AUM (₹70,570 Cr). Point 2 Established history (11+ yrs). Established history (8+ yrs). Oldest track record among peers (19 yrs). Point 3 Not Rated. Not Rated. Top rated. Point 4 Risk profile: Moderately High. Risk profile: Moderately High. Risk profile: Moderately High. Point 5 5Y return: 10.86% (lower mid). 5Y return: 10.02% (bottom quartile). 5Y return: 11.02% (upper mid). Point 6 3Y return: 12.87% (upper mid). 3Y return: 11.98% (lower mid). 3Y return: 11.90% (bottom quartile). Point 7 1Y return: 5.75% (upper mid). 1Y return: 2.18% (bottom quartile). 1Y return: 5.46% (lower mid). Point 8 1M return: 0.80% (bottom quartile). 1M return: 3.56% (lower mid). 1M return: 4.32% (upper mid). Point 9 Alpha: 0.00 (upper mid). Alpha: 0.00 (lower mid). Alpha: 0.00 (bottom quartile). Point 10 Sharpe: 0.15 (upper mid). Sharpe: -0.52 (bottom quartile). Sharpe: -0.16 (lower mid). Franklin India Multi - Asset Solution Fund
Axis Dynamic Equity Fund
ICICI Prudential Balanced Advantage Fund
Top Performing Equity Savings Funds
This scheme will invest in equity, arbitrage and debt. Equity savings will invest at least 65 percent of the total assets in stocks and a minimum 10 percent in debt. The scheme would state the minimum hedged and unhedged investments in the scheme information document.
Fund NAV Net Assets (Cr) 3 MO (%) 6 MO (%) 1 YR (%) 3 YR (%) 5 YR (%) 2025 (%) Edelweiss Equity Savings Fund Growth ₹26.9778
↑ 0.11 ₹1,365 3.6 3.8 6.6 10.8 9 8 Tata Equity Savings Fund Growth ₹56.3583
↑ 0.03 ₹285 -0.1 1.8 6.9 9.8 8 Kotak Equity Savings Fund Growth ₹27.4067
↑ 0.09 ₹10,108 2.6 1.2 4.9 9.7 9.6 7.9 Note: Returns up to 1 year are on absolute basis & more than 1 year are on CAGR basis. as on 10 Jul 26 Research Highlights & Commentary of 3 Funds showcased
Commentary Edelweiss Equity Savings Fund Tata Equity Savings Fund Kotak Equity Savings Fund Point 1 Lower mid AUM (₹1,365 Cr). Bottom quartile AUM (₹285 Cr). Highest AUM (₹10,108 Cr). Point 2 Established history (11+ yrs). Oldest track record among peers (28 yrs). Established history (11+ yrs). Point 3 Not Rated. Not Rated. Not Rated. Point 4 Risk profile: Moderately High. Risk profile: Moderately High. Risk profile: Moderately High. Point 5 5Y return: 8.98% (lower mid). 5Y return: 8.02% (bottom quartile). 5Y return: 9.62% (upper mid). Point 6 3Y return: 10.82% (upper mid). 3Y return: 9.85% (lower mid). 3Y return: 9.72% (bottom quartile). Point 7 1Y return: 6.63% (lower mid). 1Y return: 6.88% (upper mid). 1Y return: 4.87% (bottom quartile). Point 8 1M return: 2.36% (upper mid). 1M return: 0.34% (bottom quartile). 1M return: 2.16% (lower mid). Point 9 Alpha: 0.00 (upper mid). Alpha: 0.00 (lower mid). Alpha: 0.00 (bottom quartile). Point 10 Sharpe: 0.16 (upper mid). Sharpe: 0.00 (lower mid). Sharpe: -0.09 (bottom quartile). Edelweiss Equity Savings Fund
Tata Equity Savings Fund
Kotak Equity Savings Fund
Top Performing Multi Asset Allocation Funds
This scheme can invest in three asset classes, which means that they can invest in an extra asset class apart from equity and debt. The fund should invest at least 10 percent in each of the asset classes. Foreign securities will not be treated as a separate asset class.
(Erstwhile BOI AXA Mid Cap Equity And Debt Fund) The scheme's objective is to provide capital appreciation and income distribution to investors from a portfolio constituting of mid cap equity and equity related securities as well as fixed income securities.However there can be no assurance that the investment objectives of the Scheme will be realized Below is the key information for BOI AXA Mid and Small Cap Equity and Debt Fund Returns up to 1 year are on (Erstwhile SBI Magnum Monthly Income Plan Floater) To provide regular income, liquidity and attractive returns to investors in addition
to mitigating the impact of interest rate risk through an actively managed
portfolio of floating rate and fixed rate debt instruments, equity, money market
instruments and derivatives. Research Highlights for SBI Multi Asset Allocation Fund Below is the key information for SBI Multi Asset Allocation Fund Returns up to 1 year are on (Erstwhile Sundaram Balanced Fund) The scheme seeks to generate capital appreciation and current income through a judicious mix of investments in equities and fixed income securities. Research Highlights for Sundaram Equity Hybrid Fund Below is the key information for Sundaram Equity Hybrid Fund Returns up to 1 year are on (Erstwhile ICICI Prudential Dynamic Plan) To generate capital appreciation by actively investing in equity and equity related securities. For defensive considerations, the Scheme may invest in debt, money market instruments and derivatives. The investment manager will have the discretion to take aggressive asset calls i.e. by staying 100% invested in equity market/equity related instruments at a given point of time and 0% at another, in which case, the fund may be invested in debt related instruments at its discretion. The AMC may choose to churn the portfolio of the Scheme in order to achieve the investment objective. The Scheme is suitable for investors seeking high returns and for those who are willing to take commensurate risks. Research Highlights for ICICI Prudential Multi-Asset Fund Below is the key information for ICICI Prudential Multi-Asset Fund Returns up to 1 year are on (Erstwhile ICICI Prudential Balanced Fund) To generate long term capital appreciation and current income from a portfolio
that is invested in equity and equity related securities as well as in fixed income
securities. Research Highlights for ICICI Prudential Equity and Debt Fund Below is the key information for ICICI Prudential Equity and Debt Fund Returns up to 1 year are on (Erstwhile UTI Wealth Builder Fund) The objective of the Scheme is to achieve long term capital appreciation by investing predominantly in a diversified portfolio of equity and equity related instruments along with investments in Gold ETFs and Debt and Money Market Instruments. However, there can be no assurance that the investment objective of the Scheme will be achieved. Research Highlights for UTI Multi Asset Fund Below is the key information for UTI Multi Asset Fund Returns up to 1 year are on (Erstwhile IDFC Balanced Fund) The Fund seeks to generate long term capital appreciation along with current income by investing in a mix of equity and equity related securities, debt securities and money market instruments. There is no assurance or guarantee that the objectives of the scheme will be realised. Research Highlights for Bandhan Hybrid Equity Fund Below is the key information for Bandhan Hybrid Equity Fund Returns up to 1 year are on (Erstwhile Baroda Pioneer Balance Fund) The scheme is targeted for long-term capital appreciation along with stability through a well balanced portfolio comprising of equity,equity related instruments, money market instrument and debt securities. Research Highlights for Baroda Pioneer Hybrid Equity Fund Below is the key information for Baroda Pioneer Hybrid Equity Fund Returns up to 1 year are on (Erstwhile JM Balanced Fund) To provide steady current income as well as long term growth of capital. Research Highlights for JM Equity Hybrid Fund Below is the key information for JM Equity Hybrid Fund Returns up to 1 year are on (Erstwhile Kotak Balance Fund) The objective of the Scheme is to achieve growth by investing in equity and equity related instruments, balanced with income generation by investing in debt and money market instruments. Research Highlights for Kotak Equity Hybrid Fund Below is the key information for Kotak Equity Hybrid Fund Returns up to 1 year are on To generate long term capital appreciation by investing in a diversified portfolio of equity and equity related instruments, fixed income instruments & gold exchange traded funds. Research Highlights for Axis Triple Advantage Fund Below is the key information for Axis Triple Advantage Fund Returns up to 1 year are on Fund NAV Net Assets (Cr) 3 MO (%) 6 MO (%) 1 YR (%) 3 YR (%) 5 YR (%) 2025 (%) SBI Multi Asset Allocation Fund Growth ₹66.8641
↑ 0.43 ₹18,290 2.5 2.7 11.7 16.2 13.4 18.6 ICICI Prudential Multi-Asset Fund Growth ₹807.616
↑ 4.32 ₹84,165 1.9 -0.8 6.1 16 17.3 18.6 UTI Multi Asset Fund Growth ₹78.4819
↑ 0.53 ₹6,922 1.8 -0.7 5.1 15.6 13.4 11.1 Note: Returns up to 1 year are on absolute basis & more than 1 year are on CAGR basis. as on 10 Jul 26 Research Highlights & Commentary of 3 Funds showcased
Commentary SBI Multi Asset Allocation Fund ICICI Prudential Multi-Asset Fund UTI Multi Asset Fund Point 1 Lower mid AUM (₹18,290 Cr). Highest AUM (₹84,165 Cr). Bottom quartile AUM (₹6,922 Cr). Point 2 Established history (20+ yrs). Oldest track record among peers (23 yrs). Established history (17+ yrs). Point 3 Top rated. Rating: 2★ (lower mid). Rating: 1★ (bottom quartile). Point 4 Risk profile: Moderate. Risk profile: Moderately High. Risk profile: Moderately High. Point 5 5Y return: 13.41% (lower mid). 5Y return: 17.27% (upper mid). 5Y return: 13.38% (bottom quartile). Point 6 3Y return: 16.23% (upper mid). 3Y return: 15.99% (lower mid). 3Y return: 15.60% (bottom quartile). Point 7 1Y return: 11.71% (upper mid). 1Y return: 6.08% (lower mid). 1Y return: 5.11% (bottom quartile). Point 8 1M return: 2.41% (lower mid). 1M return: 2.22% (bottom quartile). 1M return: 2.50% (upper mid). Point 9 Alpha: 0.00 (upper mid). Alpha: 0.00 (lower mid). Alpha: 0.00 (bottom quartile). Point 10 Sharpe: 0.78 (upper mid). Sharpe: 0.18 (lower mid). Sharpe: 0.13 (bottom quartile). SBI Multi Asset Allocation Fund
ICICI Prudential Multi-Asset Fund
UTI Multi Asset Fund
AUM >= 200 Crore & Sorted on 3 Year CAGR Return.
1. BOI AXA Mid and Small Cap Equity and Debt Fund
BOI AXA Mid and Small Cap Equity and Debt Fund
Growth Launch Date 20 Jul 16 NAV (10 Jul 26) ₹41.9 ↑ 0.36 (0.87 %) Net Assets (Cr) ₹1,482 on 30 Apr 26 Category Hybrid - Hybrid Equity AMC BOI AXA Investment Mngrs Private Ltd Rating Risk Moderately High Expense Ratio 2.27 Sharpe Ratio 0.5 Information Ratio 0 Alpha Ratio 0 Min Investment 5,000 Min SIP Investment 1,000 Exit Load 0-1 Years (1%),1 Years and above(NIL) Growth of 10,000 investment over the years.
Date Value 30 Jun 21 ₹10,000 30 Jun 22 ₹9,742 30 Jun 23 ₹12,045 30 Jun 24 ₹18,301 30 Jun 25 ₹18,914 30 Jun 26 ₹20,302 Returns for BOI AXA Mid and Small Cap Equity and Debt Fund
absolute basis & more than 1 year are on CAGR (Compound Annual Growth Rate) basis. as on 10 Jul 26 Duration Returns 1 Month 4.6% 3 Month 9.3% 6 Month 10.8% 1 Year 8.3% 3 Year 18.9% 5 Year 14.8% 10 Year 15 Year Since launch 15.5% Historical performance (Yearly) on absolute basis
Year Returns 2025 -0.9% 2024 25.8% 2023 33.7% 2022 -4.8% 2021 54.5% 2020 31.1% 2019 -4.7% 2018 -14.2% 2017 47.1% 2016 Fund Manager information for BOI AXA Mid and Small Cap Equity and Debt Fund
Name Since Tenure Alok Singh 16 Feb 17 9.38 Yr. Data below for BOI AXA Mid and Small Cap Equity and Debt Fund as on 30 Apr 26
Asset Allocation
Asset Class Value Cash 9.83% Equity 78.48% Debt 11.69% Equity Sector Allocation
Sector Value Industrials 16.69% Financial Services 16.24% Basic Materials 13.91% Health Care 10.42% Consumer Cyclical 10.21% Technology 4.93% Consumer Defensive 3.01% Energy 0.98% Real Estate 0.9% Utility 0.77% Communication Services 0.42% Debt Sector Allocation
Sector Value Corporate 7.58% Cash Equivalent 7.09% Government 6.86% Credit Quality
Rating Value AA 8.71% AAA 91.29% Top Securities Holdings / Portfolio
Name Holding Value Quantity Abbott India Ltd (Healthcare)
Equity, Since 31 Jan 23 | ABBOTINDIA3% ₹40 Cr 15,000 Lloyds Metals & Energy Ltd (Basic Materials)
Equity, Since 28 Feb 25 | 5124553% ₹40 Cr 221,723 UNO Minda Ltd (Consumer Cyclical)
Equity, Since 31 Jul 19 | UNOMINDA2% ₹36 Cr 331,037 Aurobindo Pharma Ltd (Healthcare)
Equity, Since 31 Jan 26 | AUROPHARMA2% ₹34 Cr 240,000 Glenmark Pharmaceuticals Ltd (Healthcare)
Equity, Since 31 Jul 25 | GLENMARK2% ₹34 Cr 150,000 Indian Bank (Financial Services)
Equity, Since 31 Aug 23 | INDIANB2% ₹34 Cr 405,000 Nippon Life India Asset Management Ltd Ordinary Shares (Financial Services)
Equity, Since 31 Jan 24 | NAM-INDIA2% ₹33 Cr 300,000 Max Financial Services Ltd (Financial Services)
Equity, Since 28 Feb 26 | MFSL2% ₹32 Cr 191,000
↑ 21,000 Bank of Maharashtra (Financial Services)
Equity, Since 31 May 24 | MAHABANK2% ₹31 Cr 3,910,000 Bharat Dynamics Ltd Ordinary Shares (Industrials)
Equity, Since 31 Jul 24 | BDL2% ₹29 Cr 242,000 2. SBI Multi Asset Allocation Fund
SBI Multi Asset Allocation Fund
Growth Launch Date 21 Dec 05 NAV (10 Jul 26) ₹66.8641 ↑ 0.43 (0.65 %) Net Assets (Cr) ₹18,290 on 31 May 26 Category Hybrid - Multi Asset AMC SBI Funds Management Private Limited Rating ☆☆☆☆ Risk Moderate Expense Ratio 1.46 Sharpe Ratio 0.78 Information Ratio 0 Alpha Ratio 0 Min Investment 5,000 Min SIP Investment 500 Exit Load 0-12 Months (1%),12 Months and above(NIL) Growth of 10,000 investment over the years.
Date Value 30 Jun 21 ₹10,000 30 Jun 22 ₹10,098 30 Jun 23 ₹11,987 30 Jun 24 ₹15,440 30 Jun 25 ₹16,916 30 Jun 26 ₹18,817 Returns for SBI Multi Asset Allocation Fund
absolute basis & more than 1 year are on CAGR (Compound Annual Growth Rate) basis. as on 10 Jul 26 Duration Returns 1 Month 2.4% 3 Month 2.5% 6 Month 2.7% 1 Year 11.7% 3 Year 16.2% 5 Year 13.4% 10 Year 15 Year Since launch 9.7% Historical performance (Yearly) on absolute basis
Year Returns 2025 18.6% 2024 12.8% 2023 24.4% 2022 6% 2021 13% 2020 14.2% 2019 10.6% 2018 0.4% 2017 10.9% 2016 8.7% Fund Manager information for SBI Multi Asset Allocation Fund
Name Since Tenure Dinesh Balachandran 31 Oct 21 4.67 Yr. Mansi Sajeja 1 Dec 23 2.58 Yr. Vandna Soni 1 Jan 24 2.5 Yr. Data below for SBI Multi Asset Allocation Fund as on 31 May 26
Asset Allocation
Asset Class Value Cash 10.43% Equity 50.44% Debt 29.33% Other 9.8% Equity Sector Allocation
Sector Value Financial Services 13.27% Consumer Cyclical 5.88% Health Care 4.76% Real Estate 4.48% Utility 4.27% Energy 3.97% Basic Materials 3.94% Industrials 2.47% Consumer Defensive 2.36% Technology 2% Communication Services 1.98% Debt Sector Allocation
Sector Value Corporate 25.16% Cash Equivalent 9.53% Government 5.07% Credit Quality
Rating Value A 5.4% AA 52.44% AAA 42.16% Top Securities Holdings / Portfolio
Name Holding Value Quantity SBI Gold ETF
- | -6% ₹1,097 Cr 85,591,000 SBI Silver ETF
- | -4% ₹791 Cr 32,296,178 Brookfield India Real Estate Trust (Real Estate)
-, Since 30 Apr 25 | 5432613% ₹484 Cr 15,164,234 Bandhan Bank Ltd (Financial Services)
Equity, Since 30 Sep 24 | 5411532% ₹432 Cr 20,500,000 GAIL (India) Ltd (Utilities)
Equity, Since 31 Mar 21 | 5321552% ₹410 Cr 23,350,297 Indus Towers Ltd Ordinary Shares (Communication Services)
Equity, Since 31 Jan 26 | 5348162% ₹339 Cr 8,200,000 Biocon Ltd (Healthcare)
Equity, Since 30 Nov 24 | 5325232% ₹330 Cr 7,920,476 Syngene International Ltd (Healthcare)
Equity, Since 15 Mar 26 | 5392682% ₹317 Cr 7,000,000 ICICI Bank Ltd (Financial Services)
Equity, Since 15 Apr 22 | ICICIBANK2% ₹308 Cr 2,320,000 National Bank For Agriculture And Rural Development
Debentures | -2% ₹301 Cr 30,000 3. Sundaram Equity Hybrid Fund
Sundaram Equity Hybrid Fund
Growth Launch Date 23 Jun 00 NAV (31 Dec 21) ₹135.137 ↑ 0.78 (0.58 %) Net Assets (Cr) ₹1,954 on 30 Nov 21 Category Hybrid - Hybrid Equity AMC Sundaram Asset Management Company Ltd Rating ☆☆ Risk Moderately High Expense Ratio 2.18 Sharpe Ratio 2.64 Information Ratio -0.12 Alpha Ratio 5.81 Min Investment 5,000 Min SIP Investment 100 Exit Load 0-12 Months (1%),12 Months and above(NIL) Growth of 10,000 investment over the years.
Date Value 30 Jun 21 ₹10,000 Returns for Sundaram Equity Hybrid Fund
absolute basis & more than 1 year are on CAGR (Compound Annual Growth Rate) basis. as on 10 Jul 26 Duration Returns 1 Month 1.8% 3 Month 0.5% 6 Month 10.5% 1 Year 27.1% 3 Year 16% 5 Year 14.2% 10 Year 15 Year Since launch 12.8% Historical performance (Yearly) on absolute basis
Year Returns 2025 2024 2023 2022 2021 2020 2019 2018 2017 2016 Fund Manager information for Sundaram Equity Hybrid Fund
Name Since Tenure Data below for Sundaram Equity Hybrid Fund as on 30 Nov 21
Asset Allocation
Asset Class Value Equity Sector Allocation
Sector Value Debt Sector Allocation
Sector Value Credit Quality
Rating Value Top Securities Holdings / Portfolio
Name Holding Value Quantity 4. ICICI Prudential Multi-Asset Fund
ICICI Prudential Multi-Asset Fund
Growth Launch Date 31 Oct 02 NAV (09 Jul 26) ₹807.616 ↑ 4.32 (0.54 %) Net Assets (Cr) ₹84,165 on 31 May 26 Category Hybrid - Multi Asset AMC ICICI Prudential Asset Management Company Limited Rating ☆☆ Risk Moderately High Expense Ratio 1.47 Sharpe Ratio 0.18 Information Ratio 0 Alpha Ratio 0 Min Investment 5,000 Min SIP Investment 100 Exit Load 0-1 Years (1%),1 Years and above(NIL) Growth of 10,000 investment over the years.
Date Value 30 Jun 21 ₹10,000 30 Jun 22 ₹11,640 30 Jun 23 ₹14,219 30 Jun 24 ₹18,823 30 Jun 25 ₹21,063 30 Jun 26 ₹22,143 Returns for ICICI Prudential Multi-Asset Fund
absolute basis & more than 1 year are on CAGR (Compound Annual Growth Rate) basis. as on 10 Jul 26 Duration Returns 1 Month 2.2% 3 Month 1.9% 6 Month -0.8% 1 Year 6.1% 3 Year 16% 5 Year 17.3% 10 Year 15 Year Since launch 20.4% Historical performance (Yearly) on absolute basis
Year Returns 2025 18.6% 2024 16.1% 2023 24.1% 2022 16.8% 2021 34.7% 2020 9.9% 2019 7.7% 2018 -2.2% 2017 28.2% 2016 12.5% Fund Manager information for ICICI Prudential Multi-Asset Fund
Name Since Tenure Sankaran Naren 1 Feb 12 14.42 Yr. Manish Banthia 22 Jan 24 2.44 Yr. Akhil Kakkar 22 Jan 24 2.44 Yr. Sri Sharma 30 Apr 21 5.17 Yr. Gaurav Chikane 2 Aug 21 4.91 Yr. Sharmila D'Silva 31 Jul 22 3.92 Yr. Masoomi Jhurmarvala 4 Nov 24 1.65 Yr. Antariksha Banerjee 15 Jun 26 0.04 Yr. Data below for ICICI Prudential Multi-Asset Fund as on 31 May 26
Asset Allocation
Asset Class Value Cash 16.68% Equity 61.7% Debt 10.87% Other 10.74% Equity Sector Allocation
Sector Value Financial Services 22.64% Consumer Cyclical 12.36% Industrials 5.86% Consumer Defensive 5.41% Basic Materials 4.65% Technology 4.38% Health Care 3.13% Energy 2.78% Real Estate 2.25% Utility 2.1% Communication Services 2% Debt Sector Allocation
Sector Value Cash Equivalent 14.32% Corporate 7.18% Government 6.05% Credit Quality
Rating Value A 1.13% AA 24.49% AAA 72.52% Top Securities Holdings / Portfolio
Name Holding Value Quantity ICICI Pru Gold ETF
- | -11% ₹9,200 Cr 691,140,357
↑ 19,800,000 HDFC Bank Ltd (Financial Services)
Equity, Since 31 Jan 22 | HDFCBANK6% ₹4,834 Cr 64,922,283
↑ 13,682,715 ICICI Bank Ltd (Financial Services)
Equity, Since 31 May 06 | ICICIBANK3% ₹2,678 Cr 21,315,375 Bajaj Finserv Ltd (Financial Services)
Equity, Since 31 Jan 24 | BAJAJFINSV3% ₹2,236 Cr 12,533,749
↓ -421,423 Axis Bank Ltd (Financial Services)
Equity, Since 31 Dec 20 | AXISBANK2% ₹2,067 Cr 16,068,164
↓ -628,125 Infosys Ltd (Technology)
Equity, Since 31 Oct 19 | INFY2% ₹1,966 Cr 16,935,773
↓ -400,000 InterGlobe Aviation Ltd (Industrials)
Equity, Since 28 Feb 23 | INDIGO2% ₹1,822 Cr 4,135,656
↓ -361,200 ITC Ltd (Consumer Defensive)
Equity, Since 31 Mar 24 | ITC2% ₹1,683 Cr 58,664,918 Reliance Industries Ltd (Energy)
Equity, Since 31 Dec 20 | RELIANCE2% ₹1,587 Cr 12,011,792 Maruti Suzuki India Ltd (Consumer Cyclical)
Equity, Since 31 Aug 21 | MARUTI2% ₹1,506 Cr 1,147,022 5. ICICI Prudential Equity and Debt Fund
ICICI Prudential Equity and Debt Fund
Growth Launch Date 3 Nov 99 NAV (10 Jul 26) ₹407.73 ↑ 3.01 (0.74 %) Net Assets (Cr) ₹50,033 on 31 May 26 Category Hybrid - Hybrid Equity AMC ICICI Prudential Asset Management Company Limited Rating ☆☆☆☆ Risk Moderately High Expense Ratio 1.6 Sharpe Ratio -0.21 Information Ratio 1.77 Alpha Ratio 1.75 Min Investment 5,000 Min SIP Investment 100 Exit Load 0-1 Years (1%),1 Years and above(NIL) Growth of 10,000 investment over the years.
Date Value 30 Jun 21 ₹10,000 30 Jun 22 ₹11,521 30 Jun 23 ₹13,970 30 Jun 24 ₹19,252 30 Jun 25 ₹21,180 30 Jun 26 ₹21,663 Returns for ICICI Prudential Equity and Debt Fund
absolute basis & more than 1 year are on CAGR (Compound Annual Growth Rate) basis. as on 10 Jul 26 Duration Returns 1 Month 4.5% 3 Month 2.6% 6 Month 0.1% 1 Year 3.7% 3 Year 15.9% 5 Year 16.8% 10 Year 15 Year Since launch 14.9% Historical performance (Yearly) on absolute basis
Year Returns 2025 13.3% 2024 17.2% 2023 28.2% 2022 11.7% 2021 41.7% 2020 9% 2019 9.3% 2018 -1.9% 2017 24.8% 2016 13.7% Fund Manager information for ICICI Prudential Equity and Debt Fund
Name Since Tenure Sankaran Naren 7 Dec 15 10.57 Yr. Manish Banthia 19 Sep 13 12.79 Yr. Mittul Kalawadia 29 Dec 20 5.51 Yr. Akhil Kakkar 22 Jan 24 2.44 Yr. Sri Sharma 30 Apr 21 5.17 Yr. Sharmila D'Silva 31 Jul 22 3.92 Yr. Nitya Mishra 4 Nov 24 1.65 Yr. Data below for ICICI Prudential Equity and Debt Fund as on 31 May 26
Asset Allocation
Asset Class Value Cash 4.92% Equity 76.32% Debt 18.73% Equity Sector Allocation
Sector Value Financial Services 20.37% Consumer Cyclical 10.24% Industrials 7.7% Consumer Defensive 6.77% Energy 6.5% Health Care 5.82% Utility 4.65% Technology 4.17% Basic Materials 3.19% Real Estate 2.76% Communication Services 2.5% Debt Sector Allocation
Sector Value Corporate 12.18% Government 10.22% Cash Equivalent 1.29% Credit Quality
Rating Value A 2.66% AA 23.39% AAA 70.99% Top Securities Holdings / Portfolio
Name Holding Value Quantity HDFC Bank Ltd (Financial Services)
Equity, Since 30 Apr 21 | HDFCBANK6% ₹3,037 Cr 40,783,778
↑ 4,100,000 ICICI Bank Ltd (Financial Services)
Equity, Since 31 Jul 12 | ICICIBANK5% ₹2,439 Cr 19,413,840 Reliance Industries Ltd (Energy)
Equity, Since 30 Jun 22 | RELIANCE5% ₹2,357 Cr 17,839,980 Sun Pharmaceuticals Industries Ltd (Healthcare)
Equity, Since 31 May 16 | SUNPHARMA4% ₹2,083 Cr 11,576,148
↓ -487,900 NTPC Ltd (Utilities)
Equity, Since 28 Feb 17 | NTPC4% ₹2,010 Cr 51,962,814
↓ -2,799,000 Axis Bank Ltd (Financial Services)
Equity, Since 31 Mar 21 | AXISBANK3% ₹1,485 Cr 11,540,676
↑ 300,000 TVS Motor Co Ltd (Consumer Cyclical)
Equity, Since 28 Feb 18 | TVSMOTOR3% ₹1,336 Cr 3,981,427 Avenue Supermarts Ltd (Consumer Defensive)
Equity, Since 31 Jan 23 | DMART3% ₹1,285 Cr 3,168,463 InterGlobe Aviation Ltd (Industrials)
Equity, Since 28 Feb 23 | INDIGO2% ₹1,187 Cr 2,694,191
↑ 73,747 Tata Consultancy Services Ltd (Technology)
Equity, Since 31 Mar 24 | TCS2% ₹938 Cr 4,151,035 6. UTI Multi Asset Fund
UTI Multi Asset Fund
Growth Launch Date 21 Oct 08 NAV (10 Jul 26) ₹78.4819 ↑ 0.53 (0.68 %) Net Assets (Cr) ₹6,922 on 31 May 26 Category Hybrid - Multi Asset AMC UTI Asset Management Company Ltd Rating ☆ Risk Moderately High Expense Ratio 1.79 Sharpe Ratio 0.13 Information Ratio 0 Alpha Ratio 0 Min Investment 5,000 Min SIP Investment 500 Exit Load 0-12 Months (1%),12 Months and above(NIL) Growth of 10,000 investment over the years.
Date Value 30 Jun 21 ₹10,000 30 Jun 22 ₹9,764 30 Jun 23 ₹12,070 30 Jun 24 ₹16,534 30 Jun 25 ₹17,943 30 Jun 26 ₹18,542 Returns for UTI Multi Asset Fund
absolute basis & more than 1 year are on CAGR (Compound Annual Growth Rate) basis. as on 10 Jul 26 Duration Returns 1 Month 2.5% 3 Month 1.8% 6 Month -0.7% 1 Year 5.1% 3 Year 15.6% 5 Year 13.4% 10 Year 15 Year Since launch 12.3% Historical performance (Yearly) on absolute basis
Year Returns 2025 11.1% 2024 20.7% 2023 29.1% 2022 4.4% 2021 11.8% 2020 13.1% 2019 3.9% 2018 -0.5% 2017 17.1% 2016 7.3% Fund Manager information for UTI Multi Asset Fund
Name Since Tenure Sharwan Goyal 12 Nov 21 4.63 Yr. Jaydeep Bhowal 1 Oct 24 1.75 Yr. Lokesh Kulthia 19 Jun 26 0.03 Yr. Data below for UTI Multi Asset Fund as on 31 May 26
Asset Allocation
Asset Class Value Cash 7.54% Equity 67.52% Debt 11.29% Other 13.65% Equity Sector Allocation
Sector Value Financial Services 19.56% Consumer Defensive 9.96% Industrials 9.32% Technology 8.3% Consumer Cyclical 5.92% Basic Materials 5.19% Real Estate 4.3% Health Care 3.11% Energy 2.25% Communication Services 2.2% Debt Sector Allocation
Sector Value Government 8.36% Corporate 6.45% Cash Equivalent 4.02% Credit Quality
Rating Value AA 5.12% AAA 94.88% Top Securities Holdings / Portfolio
Name Holding Value Quantity UTI Gold ETF
- | -14% ₹955 Cr 73,012,656
↑ 250,000 ICICI Bank Ltd (Financial Services)
Equity, Since 29 Feb 24 | ICICIBANK3% ₹203 Cr 1,616,413
↑ 160,843 Kotak Mahindra Bank Ltd (Financial Services)
Equity, Since 30 Apr 25 | KOTAKBANK3% ₹192 Cr 4,993,006
↑ 1,673,435 ITC Ltd (Consumer Defensive)
Equity, Since 31 Oct 22 | ITC3% ₹187 Cr 6,503,210
↑ 233,088 HDFC Bank Ltd (Financial Services)
Equity, Since 30 Apr 25 | HDFCBANK3% ₹186 Cr 2,497,446
↑ 55,228 Nestle India Ltd (Consumer Defensive)
Equity, Since 29 Feb 24 | NESTLEIND3% ₹185 Cr 1,299,989
↑ 34,136 Tata Consultancy Services Ltd (Technology)
Equity, Since 29 Feb 24 | TCS2% ₹173 Cr 766,007
↑ 33,048 Infosys Ltd (Technology)
Equity, Since 31 Mar 24 | INFY2% ₹130 Cr 1,121,776 Bharat Electronics Ltd (Industrials)
Equity, Since 31 Oct 25 | BEL2% ₹128 Cr 3,118,720
↑ 85,870 Cummins India Ltd (Industrials)
Equity, Since 30 Apr 23 | CUMMINSIND2% ₹123 Cr 208,758 7. Bandhan Hybrid Equity Fund
Bandhan Hybrid Equity Fund
Growth Launch Date 30 Dec 16 NAV (10 Jul 26) ₹27.686 ↑ 0.26 (0.96 %) Net Assets (Cr) ₹2,021 on 31 May 26 Category Hybrid - Hybrid Equity AMC IDFC Asset Management Company Limited Rating Risk Moderately High Expense Ratio 2.35 Sharpe Ratio 0.08 Information Ratio 0.72 Alpha Ratio 6.12 Min Investment 5,000 Min SIP Investment 100 Exit Load 0-1 Years (1%),1 Years and above(NIL) Growth of 10,000 investment over the years.
Date Value 30 Jun 21 ₹10,000 30 Jun 22 ₹9,911 30 Jun 23 ₹11,798 30 Jun 24 ₹14,680 30 Jun 25 ₹16,490 30 Jun 26 ₹17,375 Returns for Bandhan Hybrid Equity Fund
absolute basis & more than 1 year are on CAGR (Compound Annual Growth Rate) basis. as on 10 Jul 26 Duration Returns 1 Month 5.2% 3 Month 5.7% 6 Month 3.7% 1 Year 7.1% 3 Year 14.3% 5 Year 12% 10 Year 15 Year Since launch 11.3% Historical performance (Yearly) on absolute basis
Year Returns 2025 7.7% 2024 21% 2023 20.4% 2022 -1.1% 2021 30.8% 2020 13.9% 2019 4.7% 2018 -3.8% 2017 16.2% 2016 Fund Manager information for Bandhan Hybrid Equity Fund
Name Since Tenure Harshal Joshi 28 Jul 21 4.93 Yr. Brijesh Shah 10 Jun 24 2.06 Yr. Prateek Poddar 7 Jun 24 2.07 Yr. Ritika Behera 7 Oct 23 2.73 Yr. Gaurav Satra 7 Jun 24 2.07 Yr. Data below for Bandhan Hybrid Equity Fund as on 31 May 26
Asset Allocation
Asset Class Value Cash 4.48% Equity 78.25% Debt 17.27% Equity Sector Allocation
Sector Value Financial Services 22.07% Consumer Cyclical 12.02% Technology 7.44% Industrials 7.25% Basic Materials 6.07% Health Care 5.92% Consumer Defensive 4.67% Utility 4.06% Energy 4.01% Communication Services 2.53% Real Estate 1.4% Debt Sector Allocation
Sector Value Corporate 13.32% Government 4.66% Cash Equivalent 3.77% Credit Quality
Rating Value AA 3.2% AAA 96.8% Top Securities Holdings / Portfolio
Name Holding Value Quantity Small Industries Development Bank Of India
Debentures | -7% ₹141 Cr 14,500,000 ICICI Bank Ltd (Financial Services)
Equity, Since 31 Jul 24 | ICICIBANK6% ₹114 Cr 904,699
↑ 49,456 HDFC Bank Ltd (Financial Services)
Equity, Since 30 Jun 24 | HDFCBANK5% ₹93 Cr 1,253,726
↑ 114,404 Reliance Industries Ltd (Energy)
Equity, Since 30 Apr 20 | RELIANCE4% ₹74 Cr 562,469
↑ 42,433 NTPC Ltd (Utilities)
Equity, Since 28 Feb 23 | NTPC4% ₹74 Cr 1,909,614
↑ 69,913 State Bank of India (Financial Services)
Equity, Since 28 Feb 21 | SBIN3% ₹56 Cr 578,627
↑ 49,160 Bajaj Housing Finance Limited
Debentures | -2% ₹49 Cr 5,000,000
↑ 2,500,000 Infosys Ltd (Technology)
Equity, Since 31 Jan 17 | INFY2% ₹48 Cr 413,181
↓ -5,370 JSW Steel Ltd (Basic Materials)
Equity, Since 31 Mar 25 | JSWSTEEL2% ₹43 Cr 334,106
↑ 26,012 Larsen & Toubro Ltd (Industrials)
Equity, Since 31 Jan 17 | LT2% ₹40 Cr 98,379
↑ 1,222 8. Baroda Pioneer Hybrid Equity Fund
Baroda Pioneer Hybrid Equity Fund
Growth Launch Date 12 Sep 03 NAV (11 Mar 22) ₹81.2894 ↑ 0.36 (0.45 %) Net Assets (Cr) ₹389 on 31 Jan 22 Category Hybrid - Hybrid Equity AMC Baroda Pioneer Asset Management Co. Ltd. Rating ☆☆☆ Risk Moderately High Expense Ratio 2.48 Sharpe Ratio 2.59 Information Ratio -0.07 Alpha Ratio 6.53 Min Investment 5,000 Min SIP Investment 500 Exit Load 0-12 Months (1%),12 Months and above(NIL) Growth of 10,000 investment over the years.
Date Value 30 Jun 21 ₹10,000 Returns for Baroda Pioneer Hybrid Equity Fund
absolute basis & more than 1 year are on CAGR (Compound Annual Growth Rate) basis. as on 10 Jul 26 Duration Returns 1 Month -2.8% 3 Month -3.5% 6 Month -0.8% 1 Year 14.8% 3 Year 14.3% 5 Year 11.2% 10 Year 15 Year Since launch 12% Historical performance (Yearly) on absolute basis
Year Returns 2025 2024 2023 2022 2021 2020 2019 2018 2017 2016 Fund Manager information for Baroda Pioneer Hybrid Equity Fund
Name Since Tenure Data below for Baroda Pioneer Hybrid Equity Fund as on 31 Jan 22
Asset Allocation
Asset Class Value Equity Sector Allocation
Sector Value Debt Sector Allocation
Sector Value Credit Quality
Rating Value Top Securities Holdings / Portfolio
Name Holding Value Quantity 9. JM Equity Hybrid Fund
JM Equity Hybrid Fund
Growth Launch Date 1 Apr 95 NAV (10 Jul 26) ₹117.859 ↑ 1.25 (1.07 %) Net Assets (Cr) ₹692 on 31 May 26 Category Hybrid - Hybrid Equity AMC JM Financial Asset Management Limited Rating ☆ Risk Moderately High Expense Ratio 2.3 Sharpe Ratio -0.52 Information Ratio 0.51 Alpha Ratio -2.49 Min Investment 5,000 Min SIP Investment 500 Exit Load 0-60 Days (1%),60 Days and above(NIL) Growth of 10,000 investment over the years.
Date Value 30 Jun 21 ₹10,000 30 Jun 22 ₹9,975 30 Jun 23 ₹12,499 30 Jun 24 ₹19,410 30 Jun 25 ₹19,479 30 Jun 26 ₹18,307 Returns for JM Equity Hybrid Fund
absolute basis & more than 1 year are on CAGR (Compound Annual Growth Rate) basis. as on 10 Jul 26 Duration Returns 1 Month 5.5% 3 Month 3.6% 6 Month -0.3% 1 Year -3.8% 3 Year 13.9% 5 Year 13.2% 10 Year 15 Year Since launch 12% Historical performance (Yearly) on absolute basis
Year Returns 2025 -3.1% 2024 27% 2023 33.8% 2022 8.1% 2021 22.9% 2020 30.5% 2019 -8.1% 2018 1.7% 2017 18.5% 2016 3% Fund Manager information for JM Equity Hybrid Fund
Name Since Tenure Satish Ramanathan 1 Oct 24 1.75 Yr. Asit Bhandarkar 31 Dec 21 4.5 Yr. Ruchi Fozdar 4 Oct 24 1.74 Yr. Deepak Gupta 11 Apr 25 1.22 Yr. Data below for JM Equity Hybrid Fund as on 31 May 26
Asset Allocation
Asset Class Value Cash 6.36% Equity 77.92% Debt 15.72% Equity Sector Allocation
Sector Value Financial Services 20.92% Technology 12.06% Consumer Cyclical 10.56% Industrials 7.86% Health Care 6.08% Basic Materials 5.86% Energy 3.57% Communication Services 3.27% Utility 2.88% Consumer Defensive 2.48% Real Estate 2.37% Debt Sector Allocation
Sector Value Corporate 12.6% Government 7.67% Cash Equivalent 1.81% Credit Quality
Rating Value AA 15.56% AAA 84.44% Top Securities Holdings / Portfolio
Name Holding Value Quantity Multi Commodity Exchange of India Ltd (Financial Services)
Equity, Since 31 May 25 | MCX3% ₹24 Cr 81,671 Bharti Airtel Ltd (Communication Services)
Equity, Since 31 Oct 24 | BHARTIARTL3% ₹23 Cr 123,746 Bajaj Finance Ltd (Financial Services)
Equity, Since 31 Jan 25 | BAJFINANCE3% ₹21 Cr 235,040 NTPC Ltd (Utilities)
Equity, Since 28 Feb 26 | NTPC3% ₹20 Cr 515,000 One97 Communications Ltd (Technology)
Equity, Since 30 Jun 25 | PAYTM3% ₹18 Cr 157,147 Reliance Industries Ltd (Energy)
Equity, Since 28 Feb 26 | RELIANCE3% ₹18 Cr 133,000 Coforge Ltd (Technology)
Equity, Since 31 May 25 | COFORGE2% ₹16 Cr 116,000 Bagmane Prime Office REIT Units (Real Estate)
-, Since 31 May 26 | BAGMANE2% ₹16 Cr 1,556,728
↑ 1,556,728 Tech Mahindra Ltd (Technology)
Equity, Since 31 Dec 23 | TECHM2% ₹15 Cr 103,000
↓ -10,000 Apollo Hospitals Enterprise Ltd (Healthcare)
Equity, Since 31 Dec 25 | APOLLOHOSP2% ₹15 Cr 18,664 10. Kotak Equity Hybrid Fund
Kotak Equity Hybrid Fund
Growth Launch Date 3 Nov 14 NAV (10 Jul 26) ₹65.369 ↑ 0.66 (1.01 %) Net Assets (Cr) ₹8,670 on 31 May 26 Category Hybrid - Hybrid Equity AMC Kotak Mahindra Asset Management Co Ltd Rating ☆☆☆ Risk Moderately High Expense Ratio 1.78 Sharpe Ratio -0.06 Information Ratio 0 Alpha Ratio 0 Min Investment 5,000 Min SIP Investment 1,000 Exit Load 0-1 Years (1%),1 Years and above(NIL) Growth of 10,000 investment over the years.
Date Value 30 Jun 21 ₹10,000 30 Jun 22 ₹10,245 30 Jun 23 ₹12,185 30 Jun 24 ₹16,056 30 Jun 25 ₹17,214 30 Jun 26 ₹17,632 Returns for Kotak Equity Hybrid Fund
absolute basis & more than 1 year are on CAGR (Compound Annual Growth Rate) basis. as on 10 Jul 26 Duration Returns 1 Month 5.1% 3 Month 5.7% 6 Month 4.1% 1 Year 4.3% 3 Year 13.6% 5 Year 12.3% 10 Year 15 Year Since launch 11.8% Historical performance (Yearly) on absolute basis
Year Returns 2025 4.1% 2024 21.7% 2023 20.1% 2022 5% 2021 28.9% 2020 15.4% 2019 14.1% 2018 -6.2% 2017 23.2% 2016 11% Fund Manager information for Kotak Equity Hybrid Fund
Name Since Tenure Abhishek Bisen 4 Jun 09 17.08 Yr. Atul Bhole 22 Jan 24 2.44 Yr. Data below for Kotak Equity Hybrid Fund as on 31 May 26
Asset Allocation
Asset Class Value Cash 10.07% Equity 78.14% Debt 11.79% Equity Sector Allocation
Sector Value Financial Services 26.77% Industrials 10.98% Basic Materials 8.74% Consumer Cyclical 7.82% Health Care 7.56% Technology 6.87% Communication Services 3.36% Consumer Defensive 2.12% Utility 1.76% Energy 1.56% Real Estate 0.6% Debt Sector Allocation
Sector Value Government 8.3% Cash Equivalent 7.06% Corporate 6.5% Credit Quality
Rating Value AA 9.68% AAA 90.32% Top Securities Holdings / Portfolio
Name Holding Value Quantity Eternal Ltd (Consumer Cyclical)
Equity, Since 30 Nov 24 | ETERNAL4% ₹334 Cr 13,329,208 Fortis Healthcare Ltd (Healthcare)
Equity, Since 31 Mar 24 | FORTIS3% ₹297 Cr 3,201,167 Bharti Airtel Ltd (Communication Services)
Equity, Since 29 Feb 24 | BHARTIARTL3% ₹291 Cr 1,591,129 HDFC Bank Ltd (Financial Services)
Equity, Since 30 Jun 11 | HDFCBANK3% ₹282 Cr 3,791,624 GE Vernova T&D India Ltd (Industrials)
Equity, Since 30 Sep 24 | GVT&D3% ₹261 Cr 507,132
↓ -166,993 State Bank of India (Financial Services)
Equity, Since 31 Aug 25 | SBIN3% ₹251 Cr 2,600,000
↑ 100,000 Cholamandalam Investment and Finance Co Ltd (Financial Services)
Equity, Since 31 Jul 25 | CHOLAFIN3% ₹241 Cr 1,567,811 UltraTech Cement Ltd (Basic Materials)
Equity, Since 30 Sep 24 | ULTRACEMCO2% ₹206 Cr 179,764 Shriram Finance Ltd (Financial Services)
Equity, Since 31 Jan 24 | SHRIRAMFIN2% ₹193 Cr 2,034,465
↑ 200,000 Bajaj Finance Ltd (Financial Services)
Equity, Since 28 Feb 25 | BAJFINANCE2% ₹181 Cr 1,990,321 11. Axis Triple Advantage Fund
Axis Triple Advantage Fund
Growth Launch Date 23 Aug 10 NAV (10 Jul 26) ₹44.6958 ↑ 0.28 (0.62 %) Net Assets (Cr) ₹2,293 on 31 May 26 Category Hybrid - Multi Asset AMC Axis Asset Management Company Limited Rating ☆☆ Risk Moderately High Expense Ratio 2.1 Sharpe Ratio 0.48 Information Ratio 0 Alpha Ratio 0 Min Investment 5,000 Min SIP Investment 1,000 Exit Load 0-12 Months (1%),12 Months and above(NIL) Growth of 10,000 investment over the years.
Date Value 30 Jun 21 ₹10,000 30 Jun 22 ₹9,694 30 Jun 23 ₹11,005 30 Jun 24 ₹13,314 30 Jun 25 ₹14,448 30 Jun 26 ₹15,853 Returns for Axis Triple Advantage Fund
absolute basis & more than 1 year are on CAGR (Compound Annual Growth Rate) basis. as on 10 Jul 26 Duration Returns 1 Month 4.2% 3 Month 3% 6 Month 1.2% 1 Year 11.8% 3 Year 13.3% 5 Year 9.7% 10 Year 15 Year Since launch 9.9% Historical performance (Yearly) on absolute basis
Year Returns 2025 15.3% 2024 15.4% 2023 12.9% 2022 -5.8% 2021 22.8% 2020 18% 2019 15.3% 2018 1.9% 2017 15.9% 2016 7.1% Fund Manager information for Axis Triple Advantage Fund
Name Since Tenure Devang Shah 5 Apr 24 2.24 Yr. Aditya Pagaria 1 Jun 24 2.08 Yr. Ashish Naik 22 Jun 16 10.03 Yr. Hardik Shah 5 Apr 24 2.24 Yr. Pratik Tibrewal 1 Feb 25 1.41 Yr. Krishnaa N 16 Dec 24 1.54 Yr. Data below for Axis Triple Advantage Fund as on 31 May 26
Asset Allocation
Asset Class Value Cash 7.69% Equity 65.43% Debt 12.75% Other 14.13% Equity Sector Allocation
Sector Value Financial Services 24.39% Consumer Cyclical 10.6% Industrials 8.38% Health Care 5.52% Basic Materials 5.01% Consumer Defensive 4.4% Energy 4.3% Technology 1.56% Communication Services 1.4% Real Estate 0.85% Utility 0.69% Debt Sector Allocation
Sector Value Cash Equivalent 7.8% Corporate 6.41% Government 6.23% Credit Quality
Rating Value A 6.74% AA 22.28% AAA 70.98% Top Securities Holdings / Portfolio
Name Holding Value Quantity Axis Gold ETF
- | -11% ₹254 Cr 19,630,000
↓ -2,025,000 ICICI Bank Ltd (Financial Services)
Equity, Since 30 Nov 18 | ICICIBANK6% ₹142 Cr 1,131,828
↑ 411,486 HDFC Bank Ltd (Financial Services)
Equity, Since 30 Sep 10 | HDFCBANK5% ₹117 Cr 1,565,899 Reliance Industries Ltd (Energy)
Equity, Since 30 Apr 19 | RELIANCE3% ₹78 Cr 587,597
↑ 80,000 Axis Silver ETF
- | -3% ₹76 Cr 2,935,398
↓ -1,454,602 Larsen & Toubro Ltd (Industrials)
Equity, Since 31 Mar 13 | LT3% ₹68 Cr 166,600 State Bank of India (Financial Services)
Equity, Since 30 Nov 22 | SBIN3% ₹67 Cr 696,529 Future on BANK Index
- | -2% -₹51 Cr 490,250
↑ 273,000 Axis Bank Ltd (Financial Services)
Equity, Since 31 Jan 26 | AXISBANK2% ₹50 Cr 389,499
↑ 96,195 National Bank For Agriculture And Rural Development
Debentures | -2% ₹50 Cr 5,000
How to Invest in Balanced Mutual Funds Online?
Open Free Investment Account for Lifetime at Fincash.com.
Complete your Registration and KYC Process
Upload Documents (PAN, Aadhaar, etc.). And, You are Ready to Invest!
All efforts have been made to ensure the information provided here is accurate. However, no guarantees are made regarding correctness of data. Please verify with scheme information document before making any investment.


AMFI Registration No. 112358 | CIN: U74999MH2016PTC282153
Shepard Technologies Pvt. Ltd. (with ARN code 112358) makes no warranties or representations, express or implied, on products offered through the platform. It accepts no liability for any damages or losses, however caused, in connection with the use of, or on the reliance of its product or related services. Terms and conditions of the website are applicable.
©2026 Shepard Technologies Private Limited. All Rights Reserved
Research Highlights for BOI AXA Mid and Small Cap Equity and Debt Fund