ٹاپ اور بہترین میوچل فنڈ کا انتخاب کیسے کریں؟
بہترین میوچل فنڈ کا انتخاب کیسے کریں؟ یہ ہر ایک کا سوال ہے۔سرمایہ کار ذہن میں ہے جبکہسرمایہ کاری ان کے پیسے. ہر کوئی بہترین کارکردگی کا مظاہرہ کرنے والے میوچل فنڈ یا سرمایہ کاری کے لیے بہترین میوچل فنڈ حاصل کرنے کے لیے بہت زیادہ تحقیق کرنے میں وقت صرف کرتا ہے! میوچل فنڈ میں جواب دینا سب سے عام لیکن مشکل ترین سوال ہے۔مارکیٹ. سیدھے الفاظ میں، ایک بہترین میوچل فنڈ کا انتخاب کرنا یا دوبارہ بیان کرنا، ایک اعلی کارکردگی کا مظاہرہ کرنے والا میوچل فنڈ کسی بھی منصوبے کے لیے صحیح پارٹنر کا انتخاب کرنے جیسا ہے۔ کوئی بھی غلط فیصلہ - دونوں طرف سے - تباہ کن نتائج کا باعث بن سکتا ہے۔
سب سے زیادہ میں سے ایکعام غلطیاں بہترین میوچل فنڈ کے انتخاب میں، جو کبھی کبھی تجربہ کار سرمایہ کار بھی کرتے ہیں، اس پر مکمل انحصار کرنا ہے۔میوچل فنڈ کی درجہ بندی یا درجہ بندی ایسا نہیں ہے کہ میوچل فنڈ کی درجہ بندی گمراہ کن ہے، لیکن اس پر مزید تحقیق کی ضرورت ہے۔ درجہ بندی پر انحصار واحد معیار نہیں ہونا چاہیے۔ ہر تین ماہ بعد کی جانے والی سرمایہ کاری کا وقتاً فوقتاً جائزہ لینے کی ضرورت ہوتی ہے تاکہ اس بات کو یقینی بنایا جا سکے کہ اس کی اچھی طرح نگرانی کی جائے۔ اس کے علاوہ، اگر دوبارہ توازن کی ضرورت ہو تو کوئی سال میں ایک بار ایسا کر سکتا ہے جب تک کہ فوری طور پر ضرورت نہ ہو۔
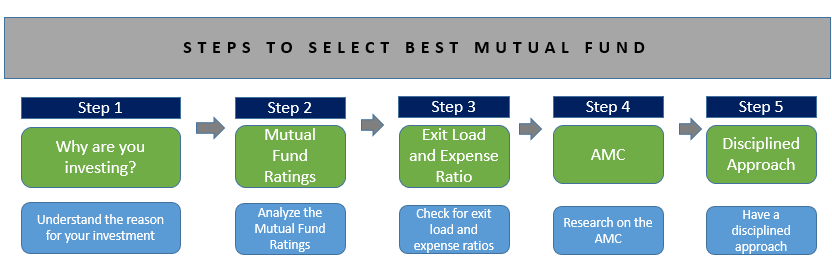
بہترین میوچل فنڈ کے انتخاب کے عمل کو دیکھنے سے پہلے، آئیے اپنی بنیادی باتیں بنائیں۔ یہ ایک اہم قدم ہے جس سے بہت سے سرمایہ کار محروم رہتے ہیں۔
آپ میوچل فنڈ میں سرمایہ کاری کیوں کر رہے ہیں؟
کسی بھی اچھی سرمایہ کاری کی طرف پہلا قدم یہ جاننا اور سمجھنا ہے کہ آپ کیوں سرمایہ کاری کر رہے ہیں اور آپ کس چیز میں سرمایہ کاری کر رہے ہیں۔ آپ کے میوچل فنڈ کی سرمایہ کاری کے پیچھے ایک واضح مقصد ہونا چاہیے۔ یہ آپ کے مستقبل کے فیصلے کو آسان بناتا ہے۔
سرمایہ کاری کرنے سے پہلے، آپ کو اپنی خطرے کی بھوک کا واضح اندازہ ہونا چاہیے۔ یہ جاننے کے لیے کہ آپ کی رسک لینے کی صلاحیت کیا ہے، آپ کو یہ کرنا چاہیے۔خطرے کی تشخیص یا خطرے کی پروفائلنگ۔ سرمایہ کاری سے پہلے خطرے کی تشخیص ضروری ہے کیونکہ یہ آپ کو واضح تصویر فراہم کرتا ہے کہ آپ کتنا خطرہ مول لے سکتے ہیں۔ کوئی بھی انٹرنیٹ پر دستیاب خطرے کی درجہ بندی کے مختلف طریقوں کو استعمال کرسکتا ہے یا کوئی ملاحظہ کرسکتا ہے۔مشیر خزانہ ایسا ہی کرنا
رسک پروفائلنگ سے گزرنے کے بعد، کسی کو اپنی توجہ متعلقہ فیصلہ کرنے کی طرف مبذول کرنی چاہیے۔اثاثہ تین ہلاک. آپ اپنی رسک لینے کی صلاحیت کے لحاظ سے اثاثوں جیسے ایکویٹی، قرض اور دیگر اثاثہ جات کے مرکب کا فیصلہ کر سکتے ہیں۔ کسی کو اپنے اثاثوں کی تقسیم کا انتخاب کرنا چاہیے کہ وہ اس خطرے کی سطح سے مماثل ہو جو وہ لے سکتا ہے یا اس سے کم جو وہ لے سکتا ہے۔ یہ اس بات کو یقینی بنائے گا کہ بعد میں دل کی جلن یا نیند کی کمی نہیں ہے۔ آپ کا اثاثہ مختص آپ کے رسک پروفائل کے لحاظ سے جارحانہ (ایکویٹی میں سرمایہ کاری کی طرف زیادہ مائل)، اعتدال پسند (ایکویٹی اور قرض کے درمیان متوازن) یا قدامت پسند (ایکویٹی میں کم سرمایہ کاری) ہوسکتا ہے۔
آئیے ایک نمونہ اثاثہ مختص پر ایک نظر ڈالتے ہیں-
| جارحانہ | اعتدال پسند | قدامت پسند | |
|---|---|---|---|
| ** سالانہ واپسی (p.a.)** | 15.7% | 13.4% | 10.8% |
| ایکویٹی | 50% | 35% | 20% |
| قرضہ | 30% | 40% | 40% |
| سونا | 10% | 10% | 10% |
| نقد | 10% | 15% | 30% |
| کل | 100% | 100% | 100% |
اپنی رسک پروفائلنگ کو مکمل کرنے اور اثاثوں کی تقسیم کا فیصلہ کرنے کے بعد، صحیح پروڈکٹ کا انتخاب باقی سب سے اہم کام ہے۔ ذیل میں وہ عوامل ہیں جن پر غور کرنے کی ضرورت ہے۔بہترین میوچل فنڈ کا انتخاب کیسے کریں۔.
Talk to our investment specialist
بہترین میوچل فنڈز کا انتخاب کیسے کریں؟
جیسا کہ پہلے کہا گیا ہے، صرف پر بہترین میوچل فنڈ کا انتخاب کرنابنیاد ان کی درجہ بندی کافی نہیں ہوسکتی ہے۔ دیگر عوامل ہیں - مقداری اور کوالیٹیٹو - جو بہترین میوچل فنڈ کے انتخاب کے عمل کو متاثر کرتے ہیں۔ آئیے ان عوامل پر ایک نظر ڈالتے ہیں۔
میوچل فنڈ کی درجہ بندی
میوچل فنڈ کی درجہ بندی آپ کو کچھ بہترین کا انتخاب کرنے میں مدد کرتی ہے۔باہمی چندہ کاروبار میں ایک مقررہ وقت پر۔ CRISIL، ICRA، MorningStar، وغیرہ ان میں سے کچھ ہیں۔درجہ بندی ایجنسیوں. وہ مختلف پیرامیٹرز پر میوچل فنڈ اسکیم کا جائزہ لیتے ہیں اور اپنے نتائج دیتے ہیں۔ یہ نتائج آپ کو اپنی ترجیحات کو کم کرنے اور بہترین میوچل فنڈ کو منتخب کرنے میں مدد کرتے ہیں۔
یہاں ایک بات قابل غور ہے کہ درجہ بندی کے ساتھ ساتھ، میوچل فنڈ اسکیموں کی ماضی کی کارکردگی پر بھی تحقیق کرنا دانشمندی ہے۔ یہ صرف آپ کے خطرے کو کم کرے گا اور آپ کے منافع میں اضافہ کرے گا۔بہترین کارکردگی کا مظاہرہ کرنے والے میوچل فنڈز پسندریلائنس میوچل فنڈ,ایس بی آئی میوچل فنڈ,UTI میوچل فنڈ، اور بہت سے دوسرے ماضی میں اچھے نتائج دیتے رہے ہیں۔
اخراجات کا تناسب
سرمایہ کاری کے لیے بہترین میوچل فنڈ کی تلاش کے دوران داخلے/خارج کے بوجھ اور اخراجات کے تناسب کو چیک کرنا بہت ضروری ہے۔ سرمایہ کاری کرنے سے پہلے آپ کو اخراجات کا تناسب ضرور چیک کرنا چاہیے۔ اعلی اخراجات کا تناسب اسکیموں کے منافع کو متاثر کرتا ہے۔ اگرچہ اخراجات کا تناسب محدود ہے۔SEBI، عام طور پر زیادہ منافع کے ساتھ کم اخراجات کے تناسب والی اسکیم کا ہونا بہتر ہے۔ تاہم، ہمیشہ یاد رکھیں، اخراجات کا تناسب ایک نسبتاً چھوٹا حصہ ہے، ایک اچھے فنڈ سے پیدا ہونے والے ریٹرن یا اضافی منافع اس کو مکمل طور پر ختم کر سکتے ہیں۔ صرف اخراجات کے تناسب کی بنیاد پر فنڈ کا انتخاب کرنا اور بعد میں اچھے فنڈ کے ذریعے واپسی سے محروم رہنا ایک پیسہ کی عقلمندی اور پاؤنڈ کی حماقت ہوگی۔ دوسرے عوامل کی طرح، اس کو دوسرے عوامل جیسے ریٹنگز، ریٹرن وغیرہ کے ساتھ مل کر دیکھنے کی ضرورت ہے اور پھر کوئی بہترین میوچل فنڈ کا انتخاب کرنے میں کامیاب ہوگا۔
لوڈ سے باہر نکلیں۔
غور کرنے کی ایک اور چیز ہے ایگزٹ لوڈ۔ سرمایہ کاری کی نوعیت کے لحاظ سے مختلف قسم کے فنڈز میں متغیر ایگزٹ بوجھ ہوتے ہیں۔ اگر آپ میچورٹی کی مدت سے پہلے اسکیم کو ختم کر دیتے ہیں تو آپ سے ایگزٹ لوڈ کا زیادہ فیصد چارج کیا جا سکتا ہے۔ یہ ظاہر ہے کہ آپ کو متاثر کرے گاسرمایہ کاری کا منصوبہ. یہعنصر سرمایہ کاری کی مدت سے ملنے کے لیے غور کیا جانا چاہیے۔ یہ یقینی بنائے گا کہ سرمایہ کاری پر کوئی ایگزٹ بوجھ نہیں پڑے گا۔
فنڈ کی عمر
ایسے فنڈ میں سرمایہ کاری کرنا جس کا کم از کم تین سال کا ٹریک ریکارڈ یا اس سے زیادہ ہو ایک اچھا خیال ہے۔ یہ کم از کم ٹائم فریم آپ کو فنڈ کی کارکردگی کا اصل میں جائزہ لینے کے لیے کچھ ڈیٹا پوائنٹس دیتا ہے۔ اےنیا فنڈ آفر(NFO)، شاید تجویز کردہ اور اچھا بھی، تاہم، میوچل فنڈ اسکیم کی کارکردگی کا کوئی ٹریک ریکارڈ نہیں ہے۔ نئی مصنوعات میں شامل ہونا بعض اوقات ایک اچھا خیال ہوسکتا ہے، لیکن اسے پورٹ فولیو کے ایک چھوٹے سے حصے تک محدود ہونا چاہیے۔ پورٹ فولیو کے ایک بڑے حصے کی سرمایہ کاری کرتے وقت، ان پروڈکٹس یا اسکیموں کے لیے ٹریک ریکارڈ کا ہونا ضروری ہے۔ کے لیےایکویٹی فنڈزتین سال کا ٹریک ریکارڈ مائع اور انتہائیمختصر مدت کے فنڈز یہاں تک کہ ایک سال کا ٹریک کافی ہو سکتا ہے (تاہم، اس کو بہت سے دوسرے عوامل کے ساتھ پورا کرنے کی ضرورت ہے)۔
ماضی کی واپسی اور اتار چڑھاؤ
زیادہ تر سرمایہ کار موجودہ مارکیٹ کے منظر نامے میں بہترین کارکردگی کا مظاہرہ کرنے والی میوچل فنڈ اسکیموں میں سرمایہ کاری کرنا چاہتے ہیں۔ اگرچہ یہ اس وقت ایک اچھی سرمایہ کاری کی طرح لگ سکتا ہے، لیکن یہ مستقبل میں بہترین میوچل فنڈ یا بہترین کارکردگی کا مظاہرہ کرنے والا میوچل فنڈ ہو سکتا ہے یا نہیں۔ ذیل میں 2011 سے 2015 تک کے اعداد و شمار پر ایک نظر ڈالیں جو ہر سال کے لیے سب سے اوپر 5 کارکردگی کا مظاہرہ کرنے والے ایکویٹی فنڈز دیتے ہیں:
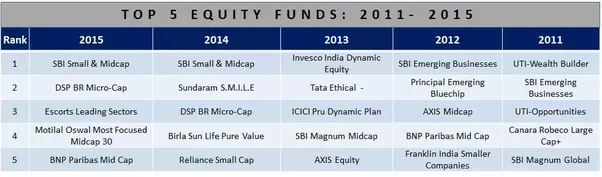
جیسا کہ آپ اوپر والے جدول سے دیکھ سکتے ہیں، ایس بی آئی سمال اینڈ مڈ کیپ اور بی این پی کے علاوہدرمیانی ٹوپیتمام اسکیمیں ہر سال کے لیے مختلف ہوتی ہیں۔ اس کا مطلب یہ ہے کہ سال کے بہترین اداکار اگلے سال کے بہترین اداکار نہیں ہیں! اس سے آپ کو اندازہ ہوتا ہے کہ جو کچھ اب بہتر ہے وہ مستقبل میں ہمیشہ بہترین ہو سکتا ہے یا نہیں بھی۔ لہذا بہترین میوچل فنڈز کی تلاش کے دوران صرف ریٹرن پر بینکنگ کرنا ہمیشہ دانشمندانہ اقدام نہیں ہوتا ہے۔ اس لیے سرمایہ کاری کرتے وقت، ایک ایسے فنڈ پر غور کریں جو ایک مدت کے لیے مستقل اور کم اتار چڑھاؤ والا ہو۔ اس کے علاوہ، سرمایہ کاری کے لیے بہترین میوچل فنڈ کا انتخاب کرنے کے لیے بہت سے دوسرے عوامل کو دیکھنا چاہیے۔
اب آئیے چند کوالیٹیٹو فیکٹرز کو دیکھتے ہیں کہ بہترین میوچل فنڈ کا انتخاب کیسے کیا جائے۔
میوچل فنڈز میں آن لائن سرمایہ کاری کیسے کریں؟
Fincash.com پر لائف ٹائم کے لیے مفت انویسٹمنٹ اکاؤنٹ کھولیں۔
اپنی رجسٹریشن اور KYC کا عمل مکمل کریں۔
دستاویزات اپ لوڈ کریں (PAN، آدھار، وغیرہ)۔اور، آپ سرمایہ کاری کے لیے تیار ہیں!
اثاثہ مینجمنٹ کمپنی کی ساکھ
اگرچہ کوئی بہت سے معیار کے عوامل کو دیکھ سکتا ہے، کسی کو فنڈ ہاؤس پر بھی توجہ دینے کی ضرورت ہے۔پیشکش میوچل فنڈ اسکیم اچھے ٹریک ریکارڈ کے ساتھ ایک قابل اعتماد اثاثہ مینجمنٹ کمپنی آپ کی مدد کر سکتی ہے۔ہوشیاری سے سرمایہ کاری کریں اور سمجھداری سے. ایک اچھااے ایم سی آپ کو سرمایہ کاری کے لیے اچھے اختیارات فراہم کرنے کے لیے مختلف قسم کی سرمایہ کاری کی اسکیمیں ہیں۔ کسی کو فنڈ ہاؤس کی عمر، مجموعی AUM، مینجمنٹ کا ٹریک ریکارڈ، فنڈ ہاؤس کی سرمایہ کاری کا عمل، تمام زمروں میں پیش کردہ اسکیموں کی تعداد اور تمام زمروں میں اعلیٰ کارکردگی کا مظاہرہ کرنے والی اسکیموں کی مجموعی تعداد کو دیکھنا چاہیے۔ لہذا ایک اچھے AMC کا انتخاب بھی بہترین میوچل فنڈ کے انتخاب کی طرف ایک اہم قدم ہے۔
| مقداری عوامل | قابلیت کے عوامل |
|---|---|
| کارکردگی کی درجہ بندی (Crisil، ValueResearch، وغیرہ) | فنڈ مینیجر کا ٹریک ریکارڈ |
| فنڈ کی عمر (3+ سال) | فنڈ ہاؤس کی ساکھ |
| ماضی کی واپسی اور فنڈ میں اتار چڑھاؤ | سرمایہ کاری کا عمل |
| اخراجات کا تناسب | |
| لوڈ سے باہر نکلیں۔ |
فنڈ مینیجر کا ٹریک ریکارڈ
فنڈ مینیجر وہ پیشہ ور ہے جو کسی اسکیم میں سرمایہ کاری کرنے کے بعد آپ کے پیسے کو سنبھالتا ہے۔ لہذا، یہ جاننا ضروری ہے کہ آپ کے پیسے کون سنبھال رہا ہے۔ آپ کو ان کا ماضی کا ریکارڈ جاننا چاہیے اور یہ دیکھنا چاہیے کہ آیا ان کی سرمایہ کاری کا انداز آپ کے مطابق ہے۔ کسی کو یہ دیکھنے کی ضرورت ہے کہ وہ کتنے سالوں سے پیسے کا انتظام کر رہے ہیں، پچھلے 5 سالوں میں ان کا ٹریک ریکارڈ (یا اس سے زیادہ) اور وہ کتنی سکیموں کا انتظام کرتے ہیں۔ یہاں کچھ بنیادی فلٹرز اچھی کارکردگی کی اسکیمیں حاصل کرنے کا باعث بنیں گے۔
سرمایہ کاری کا عمل
صرف فنڈ مینیجر کی کارکردگی پر انحصار کرنے کے بجائے، اس بات کو یقینی بنانا چاہیے کہ وہاں سرمایہ کاری کا عمل موجود ہے۔ آپ کلیدی آدمی کے خطرے کے ساتھ کسی پروڈکٹ میں نہیں جانا چاہتے ہیں۔ اگر ادارہ جاتی سرمایہ کاری کا عمل موجود ہے، تو یہ یقینی بنائے گا کہ اسکیم کا اچھی طرح سے انتظام کیا گیا ہے۔ یہاں تک کہ فنڈ مینیجر کی تبدیلی بھی ہے۔ تب آپ کی سرمایہ کاری محفوظ رہے گی۔
مانیٹر اور جائزہ: نظم و ضبط کا طریقہ اختیار کریں۔
اگر آپ مندرجہ بالا تمام عوامل پر غور کریں گے، تو آپ کو اپنے لیے بہترین میوچل فنڈ یا سرفہرست میوچل فنڈ مل سکتا ہے۔ لیکن اس بہترین میوچل فنڈ سے بہترین فائدہ اٹھانے کے لیے، آپ کو ایک نظم و ضبط کا طریقہ اختیار کرنے اور سرمایہ کاری یا اسکیم کی نگرانی کرنے کی ضرورت ہے۔ مارکیٹیں غیر مستحکم ہیں اور آپ کی سرمایہ کاری اس کی قدر کو اوپر اور نیچے دیکھ سکتی ہے۔ آپ کو میوچل فنڈ کے انتخاب میں کی گئی تحقیق اور کوششوں پر بھروسہ کرنا چاہیے اور قلیل مدتی نقصانات (خاص طور پر ایکویٹی میں) کا شکار ہونے سے بچنا چاہیے۔ سیدھے الفاظ میں، اگر آپ محسوس کرتے ہیں کہ آپ نے بہترین میوچل فنڈ کے انتخاب میں غلطی کی ہے، تو آپ کو کارروائی کرنی چاہیے اور فنڈ کو تبدیل کرنا چاہیے۔ تاہم، پہلے کے "بہترین میوچل فنڈ" کو کارکردگی دکھانے کے لیے مناسب وقت دینے سے پہلے کوئی تبدیلی نہیں کی جانی چاہیے۔ کسی کو ری بیلنس کرنا چاہیے، ایک سال سے پہلے نہیں۔ ہمیشہ یاد رکھیں، یہاں تک کہ بہترین سرمایہ کار (یہاں تک کہ وارن بفیٹ) بھی سرمایہ کاری کی غلطیاں کرتے ہیں، تاہم، ہمیں طویل مدت میں غلط فیصلے سے زیادہ درست فیصلے کرنے چاہئیں۔ یہ اس بات کو یقینی بنائے گا کہ ہمارا پورٹ فولیو یا یہاں تک کہ بہترین میوچل فنڈز وقت کے ساتھ ساتھ کارکردگی کا مظاہرہ کریں۔
سرمایہ کاری کے لیے بہترین میوچل فنڈز 2022 - 2023
Fund NAV Net Assets (Cr) 3 MO (%) 6 MO (%) 1 YR (%) 3 YR (%) 5 YR (%) 2025 (%) DSP World Gold Fund Growth ₹50.4247
↑ 1.63 ₹1,433 -12.7 -17.8 62.8 43.6 22.1 167.1 SBI Gold Fund Growth ₹41.2688
↓ -0.10 ₹15,294 -5.3 -11.5 42.4 32 22.6 71.5 ICICI Prudential Regular Gold Savings Fund Growth ₹43.6106
↓ -0.07 ₹6,265 -5.3 -13.2 42.2 32 22.5 72 HDFC Gold Fund Growth ₹42.056
↓ -0.09 ₹11,019 -5.2 -11.4 42 31.8 22.4 71.3 Aditya Birla Sun Life Gold Fund Growth ₹40.9668
↓ -0.05 ₹1,648 -5 -13.8 42.1 31.8 22.5 72 Kotak Gold Fund Growth ₹54.072
↓ -0.11 ₹6,422 -5.3 -9.4 42 31.8 22.2 70.4 IDBI Gold Fund Growth ₹36.4518
↓ -0.04 ₹757 -5.2 -14.8 41.6 31.8 22.5 79 Nippon India Gold Savings Fund Growth ₹53.8626
↓ -0.12 ₹6,854 -5.2 -13.8 41.9 31.7 22.4 71.2 Axis Gold Fund Growth ₹40.9229
↓ -0.11 ₹2,828 -5.5 -9.5 41.8 31.6 22.5 69.8 Invesco India Gold Fund Growth ₹39.5653
↓ -0.11 ₹456 -5.2 -11.4 41.4 31.4 22.3 69.6 Note: Returns up to 1 year are on absolute basis & more than 1 year are on CAGR basis. as on 30 Jul 26 Research Highlights & Commentary of 10 Funds showcased
Commentary DSP World Gold Fund SBI Gold Fund ICICI Prudential Regular Gold Savings Fund HDFC Gold Fund Aditya Birla Sun Life Gold Fund Kotak Gold Fund IDBI Gold Fund Nippon India Gold Savings Fund Axis Gold Fund Invesco India Gold Fund Point 1 Bottom quartile AUM (₹1,433 Cr). Highest AUM (₹15,294 Cr). Upper mid AUM (₹6,265 Cr). Top quartile AUM (₹11,019 Cr). Lower mid AUM (₹1,648 Cr). Upper mid AUM (₹6,422 Cr). Bottom quartile AUM (₹757 Cr). Upper mid AUM (₹6,854 Cr). Lower mid AUM (₹2,828 Cr). Bottom quartile AUM (₹456 Cr). Point 2 Oldest track record among peers (18 yrs). Established history (14+ yrs). Established history (14+ yrs). Established history (14+ yrs). Established history (14+ yrs). Established history (15+ yrs). Established history (13+ yrs). Established history (15+ yrs). Established history (14+ yrs). Established history (14+ yrs). Point 3 Top rated. Rating: 2★ (upper mid). Rating: 1★ (lower mid). Rating: 1★ (lower mid). Rating: 3★ (top quartile). Rating: 1★ (bottom quartile). Not Rated. Rating: 2★ (upper mid). Rating: 1★ (bottom quartile). Rating: 3★ (upper mid). Point 4 Risk profile: High. Risk profile: Moderately High. Risk profile: Moderately High. Risk profile: Moderately High. Risk profile: Moderately High. Risk profile: Moderately High. Risk profile: Moderately High. Risk profile: Moderately High. Risk profile: Moderately High. Risk profile: Moderately High. Point 5 5Y return: 22.15% (bottom quartile). 5Y return: 22.65% (top quartile). 5Y return: 22.46% (upper mid). 5Y return: 22.42% (lower mid). 5Y return: 22.48% (upper mid). 5Y return: 22.19% (bottom quartile). 5Y return: 22.45% (upper mid). 5Y return: 22.36% (lower mid). 5Y return: 22.48% (top quartile). 5Y return: 22.27% (bottom quartile). Point 6 3Y return: 43.62% (top quartile). 3Y return: 32.03% (top quartile). 3Y return: 31.98% (upper mid). 3Y return: 31.79% (upper mid). 3Y return: 31.78% (upper mid). 3Y return: 31.76% (lower mid). 3Y return: 31.76% (lower mid). 3Y return: 31.75% (bottom quartile). 3Y return: 31.56% (bottom quartile). 3Y return: 31.41% (bottom quartile). Point 7 1Y return: 62.77% (top quartile). 1Y return: 42.41% (top quartile). 1Y return: 42.17% (upper mid). 1Y return: 42.00% (upper mid). 1Y return: 42.10% (upper mid). 1Y return: 41.98% (lower mid). 1Y return: 41.56% (bottom quartile). 1Y return: 41.93% (lower mid). 1Y return: 41.84% (bottom quartile). 1Y return: 41.45% (bottom quartile). Point 8 Alpha: 2.12 (top quartile). 1M return: 1.02% (upper mid). 1M return: 0.97% (lower mid). 1M return: 1.01% (upper mid). 1M return: 0.98% (upper mid). 1M return: 0.90% (bottom quartile). 1M return: 0.77% (bottom quartile). 1M return: 0.96% (bottom quartile). 1M return: 0.97% (lower mid). 1M return: 1.13% (top quartile). Point 9 Sharpe: 1.22 (bottom quartile). Alpha: 0.00 (top quartile). Alpha: 0.00 (upper mid). Alpha: 0.00 (upper mid). Alpha: 0.00 (upper mid). Alpha: 0.00 (lower mid). Alpha: 0.00 (lower mid). Alpha: 0.00 (bottom quartile). Alpha: 0.00 (bottom quartile). Alpha: 0.00 (bottom quartile). Point 10 Information ratio: -0.50 (bottom quartile). Sharpe: 1.29 (upper mid). Sharpe: 1.22 (lower mid). Sharpe: 1.28 (upper mid). Sharpe: 1.20 (bottom quartile). Sharpe: 1.38 (top quartile). Sharpe: 1.22 (lower mid). Sharpe: 1.19 (bottom quartile). Sharpe: 1.35 (top quartile). Sharpe: 1.26 (upper mid). DSP World Gold Fund
SBI Gold Fund
ICICI Prudential Regular Gold Savings Fund
HDFC Gold Fund
Aditya Birla Sun Life Gold Fund
Kotak Gold Fund
IDBI Gold Fund
Nippon India Gold Savings Fund
Axis Gold Fund
Invesco India Gold Fund
* ذیل کی تفصیلی فہرست ہے۔ٹاپ میوچل فنڈز پچھلے 3 سال کی بنیاد پرسی اے جی آر واپسی
"The primary investment objective of the Scheme is to seek capital appreciation by investing predominantly in units of MLIIF - WGF. The Scheme may, at the discretion of the Investment Manager, also invest in the units of other similar overseas mutual fund schemes, which may constitute a significant part of its corpus. The Scheme may also invest a certain portion of its corpus in money market securities and/or units of money market/liquid schemes of DSP Merrill Lynch Mutual Fund, in order to meet liquidity requirements from time to time. However, there is no assurance that the investment objective of the Scheme will be realized." Research Highlights for DSP World Gold Fund Below is the key information for DSP World Gold Fund Returns up to 1 year are on The scheme seeks to provide returns that closely correspond to returns provided by SBI - ETF Gold (Previously known as SBI GETS). Research Highlights for SBI Gold Fund Below is the key information for SBI Gold Fund Returns up to 1 year are on ICICI Prudential Regular Gold Savings Fund (the Scheme) is a fund of funds scheme with the primary objective to generate returns by investing in units of ICICI Prudential Gold Exchange Traded Fund (IPru Gold ETF).
However, there can be no assurance that the investment objectives of the Scheme will be realized. Research Highlights for ICICI Prudential Regular Gold Savings Fund Below is the key information for ICICI Prudential Regular Gold Savings Fund Returns up to 1 year are on To seek capital appreciation by investing in units of HDFC Gold Exchange Traded Fund (HGETF). Research Highlights for HDFC Gold Fund Below is the key information for HDFC Gold Fund Returns up to 1 year are on An Open ended Fund of Funds Scheme with the investment objective to provide returns that tracks returns provided by Birla Sun Life Gold ETF (BSL Gold ETF). Research Highlights for Aditya Birla Sun Life Gold Fund Below is the key information for Aditya Birla Sun Life Gold Fund Returns up to 1 year are on The investment objective of the scheme is to generate returns by investing in units of Kotak Gold Exchange Traded Fund. Research Highlights for Kotak Gold Fund Below is the key information for Kotak Gold Fund Returns up to 1 year are on The investment objective of the Scheme will be to generate returns that correspond closely to the returns generated by IDBI Gold Exchange Traded Fund (IDBI GOLD ETF). Research Highlights for IDBI Gold Fund Below is the key information for IDBI Gold Fund Returns up to 1 year are on The investment objective of the Scheme is to seek to provide returns that closely correspond to returns provided by Reliance ETF Gold BeES. Research Highlights for Nippon India Gold Savings Fund Below is the key information for Nippon India Gold Savings Fund Returns up to 1 year are on To generate returns that closely correspond to returns generated by Axis Gold ETF. Research Highlights for Axis Gold Fund Below is the key information for Axis Gold Fund Returns up to 1 year are on To provide returns that closely corresponds to returns provided by Invesco India Gold Exchange Traded Fund. Research Highlights for Invesco India Gold Fund Below is the key information for Invesco India Gold Fund Returns up to 1 year are on 1. DSP World Gold Fund
DSP World Gold Fund
Growth Launch Date 14 Sep 07 NAV (30 Jul 26) ₹50.4247 ↑ 1.63 (3.33 %) Net Assets (Cr) ₹1,433 on 30 Jun 26 Category Equity - Global AMC DSP BlackRock Invmt Managers Pvt. Ltd. Rating ☆☆☆ Risk High Expense Ratio 1.41 Sharpe Ratio 1.22 Information Ratio -0.5 Alpha Ratio 2.12 Min Investment 1,000 Min SIP Investment 500 Exit Load 0-12 Months (1%),12 Months and above(NIL) Growth of 10,000 investment over the years.
Date Value 31 Jul 21 ₹10,000 31 Jul 22 ₹7,373 31 Jul 23 ₹9,366 31 Jul 24 ₹11,150 31 Jul 25 ₹16,504 31 Jul 26 ₹26,355 Returns for DSP World Gold Fund
absolute basis & more than 1 year are on CAGR (Compound Annual Growth Rate) basis. as on 30 Jul 26 Duration Returns 1 Month 2.3% 3 Month -12.7% 6 Month -17.8% 1 Year 62.8% 3 Year 43.6% 5 Year 22.1% 10 Year 15 Year Since launch 8.9% Historical performance (Yearly) on absolute basis
Year Returns 2025 167.1% 2024 15.9% 2023 7% 2022 -7.7% 2021 -9% 2020 31.4% 2019 35.1% 2018 -10.7% 2017 -4% 2016 52.7% Fund Manager information for DSP World Gold Fund
Name Since Tenure Kaivalya Nadkarni 1 May 25 1.17 Yr. Data below for DSP World Gold Fund as on 30 Jun 26
Equity Sector Allocation
Sector Value Basic Materials 94.47% Asset Allocation
Asset Class Value Cash 3.62% Equity 94.47% Debt 0% Other 1.91% Top Securities Holdings / Portfolio
Name Holding Value Quantity BGF World Gold I2
Investment Fund | -68% ₹1,141 Cr 1,005,044 VanEck Gold Miners ETF
- | GDX29% ₹490 Cr 573,719 Treps / Reverse Repo Investments
CBLO/Reverse Repo | -3% ₹54 Cr Net Receivables/Payables
Net Current Assets | -0% -₹6 Cr 2. SBI Gold Fund
SBI Gold Fund
Growth Launch Date 12 Sep 11 NAV (31 Jul 26) ₹41.2688 ↓ -0.10 (-0.24 %) Net Assets (Cr) ₹15,294 on 30 Jun 26 Category Gold - Gold AMC SBI Funds Management Private Limited Rating ☆☆ Risk Moderately High Expense Ratio 0.3 Sharpe Ratio 1.29 Information Ratio 0 Alpha Ratio 0 Min Investment 5,000 Min SIP Investment 500 Exit Load 0-1 Years (1%),1 Years and above(NIL) Growth of 10,000 investment over the years.
Date Value 31 Jul 21 ₹10,000 31 Jul 22 ₹10,500 31 Jul 23 ₹12,058 31 Jul 24 ₹13,968 31 Jul 25 ₹19,487 31 Jul 26 ₹27,752 Returns for SBI Gold Fund
absolute basis & more than 1 year are on CAGR (Compound Annual Growth Rate) basis. as on 30 Jul 26 Duration Returns 1 Month 1% 3 Month -5.3% 6 Month -11.5% 1 Year 42.4% 3 Year 32% 5 Year 22.6% 10 Year 15 Year Since launch 10% Historical performance (Yearly) on absolute basis
Year Returns 2025 71.5% 2024 19.6% 2023 14.1% 2022 12.6% 2021 -5.7% 2020 27.4% 2019 22.8% 2018 6.4% 2017 3.5% 2016 10% Fund Manager information for SBI Gold Fund
Name Since Tenure Viral Chhadva 1 Mar 26 0.33 Yr. Data below for SBI Gold Fund as on 30 Jun 26
Asset Allocation
Asset Class Value Cash 1.64% Other 98.36% Top Securities Holdings / Portfolio
Name Holding Value Quantity SBI Gold ETF
- | -100% ₹16,542 Cr 1,246,686,194
↑ 13,950,000 Net Receivable / Payable
CBLO | -0% -₹55 Cr Treps
CBLO/Reverse Repo | -0% ₹45 Cr 3. ICICI Prudential Regular Gold Savings Fund
ICICI Prudential Regular Gold Savings Fund
Growth Launch Date 11 Oct 11 NAV (31 Jul 26) ₹43.6106 ↓ -0.07 (-0.16 %) Net Assets (Cr) ₹6,265 on 30 Jun 26 Category Gold - Gold AMC ICICI Prudential Asset Management Company Limited Rating ☆ Risk Moderately High Expense Ratio 0.38 Sharpe Ratio 1.22 Information Ratio 0 Alpha Ratio 0 Min Investment 5,000 Min SIP Investment 100 Exit Load 0-15 Months (2%),15 Months and above(NIL) Growth of 10,000 investment over the years.
Date Value 31 Jul 21 ₹10,000 31 Jul 22 ₹10,447 31 Jul 23 ₹11,981 31 Jul 24 ₹13,891 31 Jul 25 ₹19,373 31 Jul 26 ₹27,543 Returns for ICICI Prudential Regular Gold Savings Fund
absolute basis & more than 1 year are on CAGR (Compound Annual Growth Rate) basis. as on 30 Jul 26 Duration Returns 1 Month 1% 3 Month -5.3% 6 Month -13.2% 1 Year 42.2% 3 Year 32% 5 Year 22.5% 10 Year 15 Year Since launch 10.5% Historical performance (Yearly) on absolute basis
Year Returns 2025 72% 2024 19.5% 2023 13.5% 2022 12.7% 2021 -5.4% 2020 26.6% 2019 22.7% 2018 7.4% 2017 0.8% 2016 8.9% Fund Manager information for ICICI Prudential Regular Gold Savings Fund
Name Since Tenure Manish Banthia 27 Sep 12 13.77 Yr. Nishit Patel 29 Dec 20 5.51 Yr. Ashwini Bharucha 1 Nov 25 0.66 Yr. Venus Ahuja 1 Nov 25 0.66 Yr. Data below for ICICI Prudential Regular Gold Savings Fund as on 30 Jun 26
Asset Allocation
Asset Class Value Cash 1.86% Other 98.14% Top Securities Holdings / Portfolio
Name Holding Value Quantity ICICI Pru Gold ETF
- | -100% ₹6,851 Cr 514,675,516
↑ 10,666,563 Treps
CBLO/Reverse Repo | -0% ₹22 Cr Net Current Assets
Net Current Assets | -0% -₹18 Cr 4. HDFC Gold Fund
HDFC Gold Fund
Growth Launch Date 24 Oct 11 NAV (31 Jul 26) ₹42.056 ↓ -0.09 (-0.22 %) Net Assets (Cr) ₹11,019 on 30 Jun 26 Category Gold - Gold AMC HDFC Asset Management Company Limited Rating ☆ Risk Moderately High Expense Ratio 0.49 Sharpe Ratio 1.28 Information Ratio 0 Alpha Ratio 0 Min Investment 5,000 Min SIP Investment 300 Exit Load 0-6 Months (2%),6-12 Months (1%),12 Months and above(NIL) Growth of 10,000 investment over the years.
Date Value 31 Jul 21 ₹10,000 31 Jul 22 ₹10,458 31 Jul 23 ₹12,010 31 Jul 24 ₹13,961 31 Jul 25 ₹19,359 31 Jul 26 ₹27,490 Returns for HDFC Gold Fund
absolute basis & more than 1 year are on CAGR (Compound Annual Growth Rate) basis. as on 30 Jul 26 Duration Returns 1 Month 1% 3 Month -5.2% 6 Month -11.4% 1 Year 42% 3 Year 31.8% 5 Year 22.4% 10 Year 15 Year Since launch 10.2% Historical performance (Yearly) on absolute basis
Year Returns 2025 71.3% 2024 18.9% 2023 14.1% 2022 12.7% 2021 -5.5% 2020 27.5% 2019 21.7% 2018 6.6% 2017 2.8% 2016 10.1% Fund Manager information for HDFC Gold Fund
Name Since Tenure Arun Agarwal 15 Feb 23 3.38 Yr. Nandita Menezes 29 Mar 25 1.26 Yr. Data below for HDFC Gold Fund as on 30 Jun 26
Asset Allocation
Asset Class Value Cash 1.47% Other 98.53% Top Securities Holdings / Portfolio
Name Holding Value Quantity HDFC Gold ETF
- | -100% ₹12,121 Cr 912,670,937
↑ 12,580,000 Treps - Tri-Party Repo
CBLO/Reverse Repo | -0% ₹17 Cr Net Current Assets
Net Current Assets | -0% -₹17 Cr 5. Aditya Birla Sun Life Gold Fund
Aditya Birla Sun Life Gold Fund
Growth Launch Date 20 Mar 12 NAV (31 Jul 26) ₹40.9668 ↓ -0.05 (-0.13 %) Net Assets (Cr) ₹1,648 on 30 Jun 26 Category Gold - Gold AMC Birla Sun Life Asset Management Co Ltd Rating ☆☆☆ Risk Moderately High Expense Ratio 0.51 Sharpe Ratio 1.2 Information Ratio 0 Alpha Ratio 0 Min Investment 100 Min SIP Investment 100 Exit Load 0-365 Days (1%),365 Days and above(NIL) Growth of 10,000 investment over the years.
Date Value 31 Jul 21 ₹10,000 31 Jul 22 ₹10,548 31 Jul 23 ₹12,046 31 Jul 24 ₹13,896 31 Jul 25 ₹19,398 31 Jul 26 ₹27,564 Returns for Aditya Birla Sun Life Gold Fund
absolute basis & more than 1 year are on CAGR (Compound Annual Growth Rate) basis. as on 30 Jul 26 Duration Returns 1 Month 1% 3 Month -5% 6 Month -13.8% 1 Year 42.1% 3 Year 31.8% 5 Year 22.5% 10 Year 15 Year Since launch 10.3% Historical performance (Yearly) on absolute basis
Year Returns 2025 72% 2024 18.7% 2023 14.5% 2022 12.3% 2021 -5% 2020 26% 2019 21.3% 2018 6.8% 2017 1.6% 2016 11.5% Fund Manager information for Aditya Birla Sun Life Gold Fund
Name Since Tenure Priya Sridhar 31 Dec 24 1.5 Yr. Data below for Aditya Birla Sun Life Gold Fund as on 30 Jun 26
Asset Allocation
Asset Class Value Cash 1.57% Other 98.43% Top Securities Holdings / Portfolio
Name Holding Value Quantity Aditya BSL Gold ETF
- | -100% ₹1,821 Cr 133,076,381
↑ 939,171 Clearing Corporation Of India Limited
CBLO/Reverse Repo | -0% ₹5 Cr Net Receivables / (Payables)
Net Current Assets | -0% -₹4 Cr 6. Kotak Gold Fund
Kotak Gold Fund
Growth Launch Date 25 Mar 11 NAV (31 Jul 26) ₹54.072 ↓ -0.11 (-0.20 %) Net Assets (Cr) ₹6,422 on 30 Jun 26 Category Gold - Gold AMC Kotak Mahindra Asset Management Co Ltd Rating ☆ Risk Moderately High Expense Ratio 0.5 Sharpe Ratio 1.38 Information Ratio 0 Alpha Ratio 0 Min Investment 5,000 Min SIP Investment 1,000 Exit Load 0-6 Months (2%),6-12 Months (1%),12 Months and above(NIL) Growth of 10,000 investment over the years.
Date Value 31 Jul 21 ₹10,000 31 Jul 22 ₹10,434 31 Jul 23 ₹11,908 31 Jul 24 ₹13,751 31 Jul 25 ₹19,186 31 Jul 26 ₹27,240 Returns for Kotak Gold Fund
absolute basis & more than 1 year are on CAGR (Compound Annual Growth Rate) basis. as on 30 Jul 26 Duration Returns 1 Month 0.9% 3 Month -5.3% 6 Month -9.4% 1 Year 42% 3 Year 31.8% 5 Year 22.2% 10 Year 15 Year Since launch 11.6% Historical performance (Yearly) on absolute basis
Year Returns 2025 70.4% 2024 18.9% 2023 13.9% 2022 11.7% 2021 -4.7% 2020 26.6% 2019 24.1% 2018 7.3% 2017 2.5% 2016 10.2% Fund Manager information for Kotak Gold Fund
Name Since Tenure Abhishek Bisen 25 Mar 11 15.28 Yr. Jeetu Sonar 1 Oct 22 3.75 Yr. Data below for Kotak Gold Fund as on 30 Jun 26
Asset Allocation
Asset Class Value Cash 1.6% Other 98.4% Top Securities Holdings / Portfolio
Name Holding Value Quantity Kotak Gold ETF
- | -100% ₹7,050 Cr 542,538,125
↑ 6,708,000 Triparty Repo
CBLO/Reverse Repo | -0% ₹26 Cr Net Current Assets/(Liabilities)
Net Current Assets | -0% -₹11 Cr 7. IDBI Gold Fund
IDBI Gold Fund
Growth Launch Date 14 Aug 12 NAV (31 Jul 26) ₹36.4518 ↓ -0.04 (-0.12 %) Net Assets (Cr) ₹757 on 30 Jun 26 Category Gold - Gold AMC IDBI Asset Management Limited Rating Risk Moderately High Expense Ratio 0.64 Sharpe Ratio 1.22 Information Ratio 0 Alpha Ratio 0 Min Investment 5,000 Min SIP Investment 500 Exit Load 0-12 Months (1%),12 Months and above(NIL) Growth of 10,000 investment over the years.
Date Value 31 Jul 21 ₹10,000 31 Jul 22 ₹10,431 31 Jul 23 ₹12,037 31 Jul 24 ₹14,109 31 Jul 25 ₹19,450 31 Jul 26 ₹27,534 Returns for IDBI Gold Fund
absolute basis & more than 1 year are on CAGR (Compound Annual Growth Rate) basis. as on 30 Jul 26 Duration Returns 1 Month 0.8% 3 Month -5.2% 6 Month -14.8% 1 Year 41.6% 3 Year 31.8% 5 Year 22.5% 10 Year 15 Year Since launch 9.7% Historical performance (Yearly) on absolute basis
Year Returns 2025 79% 2024 18.7% 2023 14.8% 2022 12% 2021 -4% 2020 24.2% 2019 21.6% 2018 5.8% 2017 1.4% 2016 8.3% Fund Manager information for IDBI Gold Fund
Name Since Tenure Sumit Bhatnagar 1 Jun 24 2.08 Yr. Data below for IDBI Gold Fund as on 30 Jun 26
Asset Allocation
Asset Class Value Cash 1.65% Other 98.35% Top Securities Holdings / Portfolio
Name Holding Value Quantity LIC MF Gold ETF
- | -100% ₹823 Cr 58,774,200
↑ 705,000 Treps
CBLO/Reverse Repo | -0% ₹3 Cr Net Receivables / (Payables)
CBLO | -0% -₹2 Cr 8. Nippon India Gold Savings Fund
Nippon India Gold Savings Fund
Growth Launch Date 7 Mar 11 NAV (31 Jul 26) ₹53.8626 ↓ -0.12 (-0.22 %) Net Assets (Cr) ₹6,854 on 30 Jun 26 Category Gold - Gold AMC Nippon Life Asset Management Ltd. Rating ☆☆ Risk Moderately High Expense Ratio 0.35 Sharpe Ratio 1.19 Information Ratio 0 Alpha Ratio 0 Min Investment 5,000 Min SIP Investment 100 Exit Load 0-1 Years (2%),1 Years and above(NIL) Growth of 10,000 investment over the years.
Date Value 31 Jul 21 ₹10,000 31 Jul 22 ₹10,465 31 Jul 23 ₹11,992 31 Jul 24 ₹13,843 31 Jul 25 ₹19,321 31 Jul 26 ₹27,423 Returns for Nippon India Gold Savings Fund
absolute basis & more than 1 year are on CAGR (Compound Annual Growth Rate) basis. as on 30 Jul 26 Duration Returns 1 Month 1% 3 Month -5.2% 6 Month -13.8% 1 Year 41.9% 3 Year 31.7% 5 Year 22.4% 10 Year 15 Year Since launch 11.6% Historical performance (Yearly) on absolute basis
Year Returns 2025 71.2% 2024 19% 2023 14.3% 2022 12.3% 2021 -5.5% 2020 26.6% 2019 22.5% 2018 6% 2017 1.7% 2016 11.6% Fund Manager information for Nippon India Gold Savings Fund
Name Since Tenure Himanshu Mange 23 Dec 23 2.52 Yr. Data below for Nippon India Gold Savings Fund as on 30 Jun 26
Asset Allocation
Asset Class Value Cash 1.61% Other 98.39% Top Securities Holdings / Portfolio
Name Holding Value Quantity Nippon India ETF Gold BeES
- | -100% ₹7,553 Cr 587,063,572
↑ 5,276,000 Triparty Repo
CBLO/Reverse Repo | -0% ₹13 Cr Net Current Assets
Net Current Assets | -0% -₹12 Cr Cash Margin - Ccil
CBLO/Reverse Repo | -0% ₹0 Cr 9. Axis Gold Fund
Axis Gold Fund
Growth Launch Date 20 Oct 11 NAV (31 Jul 26) ₹40.9229 ↓ -0.11 (-0.27 %) Net Assets (Cr) ₹2,828 on 30 Jun 26 Category Gold - Gold AMC Axis Asset Management Company Limited Rating ☆ Risk Moderately High Expense Ratio 0.5 Sharpe Ratio 1.35 Information Ratio 0 Alpha Ratio 0 Min Investment 5,000 Min SIP Investment 1,000 Exit Load 0-1 Years (1%),1 Years and above(NIL) Growth of 10,000 investment over the years.
Date Value 31 Jul 21 ₹10,000 31 Jul 22 ₹10,512 31 Jul 23 ₹12,108 31 Jul 24 ₹14,013 31 Jul 25 ₹19,436 31 Jul 26 ₹27,568 Returns for Axis Gold Fund
absolute basis & more than 1 year are on CAGR (Compound Annual Growth Rate) basis. as on 30 Jul 26 Duration Returns 1 Month 1% 3 Month -5.5% 6 Month -9.5% 1 Year 41.8% 3 Year 31.6% 5 Year 22.5% 10 Year 15 Year Since launch 10% Historical performance (Yearly) on absolute basis
Year Returns 2025 69.8% 2024 19.2% 2023 14.7% 2022 12.5% 2021 -4.7% 2020 26.9% 2019 23.1% 2018 8.3% 2017 0.7% 2016 10.7% Fund Manager information for Axis Gold Fund
Name Since Tenure Aditya Pagaria 9 Nov 21 4.64 Yr. Pratik Tibrewal 1 Feb 25 1.41 Yr. Data below for Axis Gold Fund as on 30 Jun 26
Asset Allocation
Asset Class Value Cash 1.81% Other 98.19% Top Securities Holdings / Portfolio
Name Holding Value Quantity Axis Gold ETF
- | -100% ₹3,091 Cr 238,687,058
↑ 2,659,572 Clearing Corporation Of India Ltd
CBLO | -0% ₹6 Cr Net Receivables / (Payables)
CBLO | -0% -₹5 Cr 10. Invesco India Gold Fund
Invesco India Gold Fund
Growth Launch Date 5 Dec 11 NAV (31 Jul 26) ₹39.5653 ↓ -0.11 (-0.28 %) Net Assets (Cr) ₹456 on 30 Jun 26 Category Gold - Gold AMC Invesco Asset Management (India) Private Ltd Rating ☆☆☆ Risk Moderately High Expense Ratio 0.37 Sharpe Ratio 1.26 Information Ratio 0 Alpha Ratio 0 Min Investment 5,000 Min SIP Investment 500 Exit Load 0-6 Months (2%),6-12 Months (1%),12 Months and above(NIL) Growth of 10,000 investment over the years.
Date Value 31 Jul 21 ₹10,000 31 Jul 22 ₹10,612 31 Jul 23 ₹12,044 31 Jul 24 ₹13,970 31 Jul 25 ₹19,323 31 Jul 26 ₹27,333 Returns for Invesco India Gold Fund
absolute basis & more than 1 year are on CAGR (Compound Annual Growth Rate) basis. as on 30 Jul 26 Duration Returns 1 Month 1.1% 3 Month -5.2% 6 Month -11.4% 1 Year 41.4% 3 Year 31.4% 5 Year 22.3% 10 Year 15 Year Since launch 9.8% Historical performance (Yearly) on absolute basis
Year Returns 2025 69.6% 2024 18.8% 2023 14.5% 2022 12.8% 2021 -5.5% 2020 27.2% 2019 21.4% 2018 6.6% 2017 1.3% 2016 21.6% Fund Manager information for Invesco India Gold Fund
Name Since Tenure Abhisek Bahinipati 1 Nov 25 0.66 Yr. Data below for Invesco India Gold Fund as on 30 Jun 26
Asset Allocation
Asset Class Value Cash 3.8% Other 96.2% Top Securities Holdings / Portfolio
Name Holding Value Quantity Invesco India Gold ETF
- | -98% ₹491 Cr 36,331,900
↑ 120,000 Triparty Repo
CBLO/Reverse Repo | -2% ₹12 Cr Net Receivables / (Payables)
CBLO | -0% ₹0 Cr
جیسا کہ اوپر کہا گیا ہے، ایک بہترین میوچل فنڈ کا انتخاب ایک مشکل کام ہے جس میں تحقیق کی ضرورت ہوتی ہے۔ آپ کو بہترین میوچل فنڈ اسکیم کے انتخاب میں محتاط رہنا ہوگا، تمام خطرات کا اندازہ لگانا چاہیے اور ان بہت سے عوامل کو مدنظر رکھنا چاہیے جو سب سے اوپر اور بہترین میوچل فنڈ کے انتخاب میں جاتے ہیں۔ باقاعدگی سے سرمایہ کاری کرنے سے اتار چڑھاؤ کا خطرہ کم ہوتا ہے اور آپ کو بہتر منافع ملتا ہے۔ اگر کوئی وقت کے ساتھ لگاتار سرمایہ کاری کرتا ہے تو یہ مستقبل میں اچھے نتائج کا باعث بنے گا۔ ہمیشہ یاد رکھیں، یہ بازار کا وقت نہیں ہے جو پیسہ کماتا ہے، یہ وہ وقت ہے جو آپ بازار میں گزارتے ہیں!
یہاں فراہم کردہ معلومات کے درست ہونے کو یقینی بنانے کے لیے تمام کوششیں کی گئی ہیں۔ تاہم، ڈیٹا کی درستگی کے حوالے سے کوئی ضمانت نہیں دی جاتی ہے۔ براہ کرم کوئی بھی سرمایہ کاری کرنے سے پہلے اسکیم کی معلومات کے دستاویز کے ساتھ تصدیق کریں۔


AMFI Registration No. 112358 | CIN: U74999MH2016PTC282153
Shepard Technologies Pvt. Ltd. (with ARN code 112358) makes no warranties or representations, express or implied, on products offered through the platform. It accepts no liability for any damages or losses, however caused, in connection with the use of, or on the reliance of its product or related services. Terms and conditions of the website are applicable.
©2026 Shepard Technologies Private Limited. All Rights Reserved
Nice post, thanks