Best Mutual Funds in India for SIP 2026 – 2027
A Systematic Investment plan (SIP) is considered to be the most efficient way to invest in Mutual Funds, especially for the long-term plan. It permits investors to purchase a unit on a particular date every month in order to implement a long-term savings plan. One of the reasons why investors feel comfortable towards Investing in SIP is the flexibility they offer. Investors can invest in SIP on either monthly, quarterly or weekly basis, as per their convenience. Let’s learn more about how one can achieve their Financial goals with systematic investment plans, how sip calculator is helpful in investment, along with best mutual funds in India for SIP.
SIP- Optimal Way to Achieve Financial Goals
SIP is designed in a way that one can easily pre-plan their investments and invest according to their financial goals. But, one has to invest for a long-time to achieve goals via SIP. Generally, SIP is widely used for planning goals like-
Talk to our investment specialist
- Buying a car
- Buying a house
- Marriage
- Child’s education
- Save for an international trip
- retirement
- Medical emergencies etc.
One can start investing in SIPs with an amount as minimum as INR 500 and INR 1000. Once you begin investing in SIP your money start going each day as it is exposed to the stock market. That is why SIPs as a route is mostly preferred in Equity Funds. Moreover, historically, investment in equity stocks has given impressive returns amongst all the other asset classes, if the investment was done with discipline and with a long-term horizon.
SIP in equity helps to avoid the risk of timing the market and facilitate wealth creation by averaging the cost of investment. Let’s look at some more Benefits of SIP that helps in achieving long-term goals:
Power of Compounding- Simple interest is when you gain interest on only the principal. In the case of compound interest, the interest amount is added to the principal, and interest is calculated on the new principal (old principal plus gains). This process continues every time. Since SIP in Mutual Funds are in instalments, they are compounded, which adds more to the initially invested sum.
Risk reduction- Given that a SIP is spread over a long period of time, one catches all periods of the stock market, the ups and more importantly the downturns. In downturns, when fear catches most investors, SIP instalments continue ensuring the investors buy “low”.
Convenience of SIPs- Convenience is one of the biggest benefits of a SIP. A user has to sign-up one-time and go through documentation. Once done, thereafter debits for subsequent investments take place automatically and the investor just has to monitor the investments.
Best Mutual Funds in India for SIP 2026 - 2027
Fund Selection Methodology used to find 5 funds
Best Large Cap Funds for SIP
Fund NAV Net Assets (Cr) Min SIP Investment 3 MO (%) 6 MO (%) 1 YR (%) 3 YR (%) 5 YR (%) 2025 (%) Invesco India Largecap Fund Growth ₹70.19
↓ -0.44 ₹1,847 100 3.9 3.2 0.6 12.6 11.5 5.5 ICICI Prudential Bluechip Fund Growth ₹107.21
↓ -0.26 ₹79,421 100 0.5 -2.9 -2.6 11.7 12.8 11.3 Bandhan Large Cap Fund Growth ₹76.654
↓ -0.32 ₹2,061 100 2 0 -0.9 11.6 11 8.2 Nippon India Large Cap Fund Growth ₹88.3163
↓ -0.36 ₹53,227 100 -0.6 -1.6 -2.8 11.4 14.6 9.2 DSP TOP 100 Equity Growth ₹452.213
↓ -0.62 ₹7,190 500 0.4 -3.3 -5.3 11.1 9.9 8.4 Note: Returns up to 1 year are on absolute basis & more than 1 year are on CAGR basis. as on 24 Jul 26 Research Highlights & Commentary of 5 Funds showcased
Commentary Invesco India Largecap Fund ICICI Prudential Bluechip Fund Bandhan Large Cap Fund Nippon India Large Cap Fund DSP TOP 100 Equity Point 1 Bottom quartile AUM (₹1,847 Cr). Highest AUM (₹79,421 Cr). Bottom quartile AUM (₹2,061 Cr). Upper mid AUM (₹53,227 Cr). Lower mid AUM (₹7,190 Cr). Point 2 Established history (16+ yrs). Established history (18+ yrs). Established history (20+ yrs). Established history (18+ yrs). Oldest track record among peers (23 yrs). Point 3 Rating: 3★ (lower mid). Top rated. Rating: 2★ (bottom quartile). Rating: 4★ (upper mid). Rating: 2★ (bottom quartile). Point 4 Risk profile: Moderately High. Risk profile: Moderately High. Risk profile: Moderately High. Risk profile: Moderately High. Risk profile: Moderately High. Point 5 5Y return: 11.46% (lower mid). 5Y return: 12.76% (upper mid). 5Y return: 11.02% (bottom quartile). 5Y return: 14.56% (top quartile). 5Y return: 9.95% (bottom quartile). Point 6 3Y return: 12.63% (top quartile). 3Y return: 11.74% (upper mid). 3Y return: 11.55% (lower mid). 3Y return: 11.42% (bottom quartile). 3Y return: 11.07% (bottom quartile). Point 7 1Y return: 0.57% (top quartile). 1Y return: -2.62% (lower mid). 1Y return: -0.87% (upper mid). 1Y return: -2.76% (bottom quartile). 1Y return: -5.33% (bottom quartile). Point 8 Alpha: 3.75 (top quartile). Alpha: -1.21 (bottom quartile). Alpha: 2.34 (upper mid). Alpha: 1.07 (lower mid). Alpha: -2.70 (bottom quartile). Point 9 Sharpe: -0.25 (top quartile). Sharpe: -0.55 (bottom quartile). Sharpe: -0.35 (upper mid). Sharpe: -0.43 (lower mid). Sharpe: -0.68 (bottom quartile). Point 10 Information ratio: 0.82 (lower mid). Information ratio: 0.85 (upper mid). Information ratio: 0.63 (bottom quartile). Information ratio: 0.98 (top quartile). Information ratio: 0.53 (bottom quartile). Invesco India Largecap Fund
ICICI Prudential Bluechip Fund
Bandhan Large Cap Fund
Nippon India Large Cap Fund
DSP TOP 100 Equity
Best Multi Cap Funds for SIP
Fund NAV Net Assets (Cr) Min SIP Investment 3 MO (%) 6 MO (%) 1 YR (%) 3 YR (%) 5 YR (%) 2025 (%) Aditya Birla Sun Life Manufacturing Equity Fund Growth ₹37.54
↓ -0.10 ₹1,229 1,000 7.7 19.1 16.4 19.6 13.8 3.5 Motilal Oswal Multicap 35 Fund Growth ₹59.2316
↓ -0.38 ₹13,294 500 6.3 4 -4.1 17.5 11.8 -5.6 BNP Paribas Multi Cap Fund Growth ₹73.5154
↓ -0.01 ₹588 300 -4.6 -2.6 19.3 17.3 13.6 Mahindra Badhat Yojana Growth ₹37.7183
↓ 0.00 ₹6,926 500 5.6 9 4.6 16.5 15.2 3.4 ICICI Prudential Multicap Fund Growth ₹838.16
↓ -1.27 ₹18,194 100 3.4 9.9 4.6 16.4 14.9 5.7 Note: Returns up to 1 year are on absolute basis & more than 1 year are on CAGR basis. as on 24 Jul 26 Research Highlights & Commentary of 5 Funds showcased
Commentary Aditya Birla Sun Life Manufacturing Equity Fund Motilal Oswal Multicap 35 Fund BNP Paribas Multi Cap Fund Mahindra Badhat Yojana ICICI Prudential Multicap Fund Point 1 Bottom quartile AUM (₹1,229 Cr). Upper mid AUM (₹13,294 Cr). Bottom quartile AUM (₹588 Cr). Lower mid AUM (₹6,926 Cr). Highest AUM (₹18,194 Cr). Point 2 Established history (11+ yrs). Established history (12+ yrs). Established history (20+ yrs). Established history (9+ yrs). Oldest track record among peers (31 yrs). Point 3 Not Rated. Top rated. Rating: 4★ (upper mid). Not Rated. Rating: 3★ (lower mid). Point 4 Risk profile: High. Risk profile: Moderately High. Risk profile: Moderately High. Risk profile: Moderately High. Risk profile: Moderately High. Point 5 5Y return: 13.82% (lower mid). 5Y return: 11.76% (bottom quartile). 5Y return: 13.57% (bottom quartile). 5Y return: 15.19% (top quartile). 5Y return: 14.87% (upper mid). Point 6 3Y return: 19.61% (top quartile). 3Y return: 17.48% (upper mid). 3Y return: 17.28% (lower mid). 3Y return: 16.51% (bottom quartile). 3Y return: 16.41% (bottom quartile). Point 7 1Y return: 16.44% (upper mid). 1Y return: -4.12% (bottom quartile). 1Y return: 19.34% (top quartile). 1Y return: 4.63% (bottom quartile). 1Y return: 4.65% (lower mid). Point 8 Alpha: 0.00 (lower mid). Alpha: -7.36 (bottom quartile). Alpha: 0.00 (bottom quartile). Alpha: 4.46 (upper mid). Alpha: 6.49 (top quartile). Point 9 Sharpe: 0.54 (upper mid). Sharpe: -0.74 (bottom quartile). Sharpe: 2.86 (top quartile). Sharpe: 0.01 (bottom quartile). Sharpe: 0.09 (lower mid). Point 10 Information ratio: 0.00 (bottom quartile). Information ratio: 0.53 (lower mid). Information ratio: 0.00 (bottom quartile). Information ratio: 0.64 (top quartile). Information ratio: 0.61 (upper mid). Aditya Birla Sun Life Manufacturing Equity Fund
Motilal Oswal Multicap 35 Fund
BNP Paribas Multi Cap Fund
Mahindra Badhat Yojana
ICICI Prudential Multicap Fund
Best Mid Cap Funds for SIP
Fund NAV Net Assets (Cr) Min SIP Investment 3 MO (%) 6 MO (%) 1 YR (%) 3 YR (%) 5 YR (%) 2025 (%) ICICI Prudential MidCap Fund Growth ₹331.16
↓ -0.90 ₹7,846 100 1.8 11.2 8.9 22.2 16.9 11.1 BNP Paribas Mid Cap Fund Growth ₹109.899
↓ -0.34 ₹2,513 300 3 9.6 8 17.8 14.7 2.5 TATA Mid Cap Growth Fund Growth ₹458.291
↑ 0.31 ₹5,868 150 4 7 5 17 15.2 5.8 Aditya Birla Sun Life Midcap Fund Growth ₹829.74
↑ 1.78 ₹6,624 1,000 5.1 9.2 3.6 16.6 14.5 4.4 Note: Returns up to 1 year are on absolute basis & more than 1 year are on CAGR basis. as on 24 Jul 26 Research Highlights & Commentary of 4 Funds showcased
Commentary ICICI Prudential MidCap Fund BNP Paribas Mid Cap Fund TATA Mid Cap Growth Fund Aditya Birla Sun Life Midcap Fund Point 1 Highest AUM (₹7,846 Cr). Bottom quartile AUM (₹2,513 Cr). Lower mid AUM (₹5,868 Cr). Upper mid AUM (₹6,624 Cr). Point 2 Established history (21+ yrs). Established history (20+ yrs). Oldest track record among peers (32 yrs). Established history (23+ yrs). Point 3 Rating: 2★ (lower mid). Top rated. Rating: 2★ (bottom quartile). Rating: 3★ (upper mid). Point 4 Risk profile: Moderately High. Risk profile: High. Risk profile: Moderately High. Risk profile: Moderately High. Point 5 5Y return: 16.90% (top quartile). 5Y return: 14.73% (lower mid). 5Y return: 15.17% (upper mid). 5Y return: 14.46% (bottom quartile). Point 6 3Y return: 22.21% (top quartile). 3Y return: 17.82% (upper mid). 3Y return: 16.98% (lower mid). 3Y return: 16.63% (bottom quartile). Point 7 1Y return: 8.93% (top quartile). 1Y return: 8.00% (upper mid). 1Y return: 5.05% (lower mid). 1Y return: 3.58% (bottom quartile). Point 8 Alpha: 6.02 (top quartile). Alpha: 3.32 (upper mid). Alpha: -0.52 (bottom quartile). Alpha: -0.17 (lower mid). Point 9 Sharpe: 0.32 (top quartile). Sharpe: 0.22 (upper mid). Sharpe: -0.01 (bottom quartile). Sharpe: 0.01 (lower mid). Point 10 Information ratio: 0.87 (top quartile). Information ratio: -0.21 (upper mid). Information ratio: -0.66 (bottom quartile). Information ratio: -0.44 (lower mid). ICICI Prudential MidCap Fund
BNP Paribas Mid Cap Fund
TATA Mid Cap Growth Fund
Aditya Birla Sun Life Midcap Fund
Best Small Cap Funds for SIP
Fund NAV Net Assets (Cr) Min SIP Investment 3 MO (%) 6 MO (%) 1 YR (%) 3 YR (%) 5 YR (%) 2025 (%) DSP Small Cap Fund Growth ₹219.619
↑ 0.10 ₹19,635 500 9.6 20.5 8.3 16.8 16.9 -2.8 Sundaram Small Cap Fund Growth ₹282.502
↓ -0.21 ₹3,872 100 7.2 16 7 16.6 15.9 0.4 IDBI Small Cap Fund Growth ₹32.6986
↑ 0.00 ₹743 500 8.3 22.8 4.3 16.1 16.7 -13.4 Nippon India Small Cap Fund Growth ₹177.561
↑ 0.36 ₹78,407 100 5.7 14.9 2.3 16.1 18.4 -4.7 Aditya Birla Sun Life Small Cap Fund Growth ₹94.7343
↓ -0.19 ₹5,731 1,000 8.4 19.8 7.5 15.1 12.4 -3.7 Note: Returns up to 1 year are on absolute basis & more than 1 year are on CAGR basis. as on 24 Jul 26 Research Highlights & Commentary of 5 Funds showcased
Commentary DSP Small Cap Fund Sundaram Small Cap Fund IDBI Small Cap Fund Nippon India Small Cap Fund Aditya Birla Sun Life Small Cap Fund Point 1 Upper mid AUM (₹19,635 Cr). Bottom quartile AUM (₹3,872 Cr). Bottom quartile AUM (₹743 Cr). Highest AUM (₹78,407 Cr). Lower mid AUM (₹5,731 Cr). Point 2 Established history (19+ yrs). Oldest track record among peers (21 yrs). Established history (9+ yrs). Established history (15+ yrs). Established history (19+ yrs). Point 3 Rating: 4★ (upper mid). Rating: 3★ (bottom quartile). Not Rated. Rating: 4★ (lower mid). Top rated. Point 4 Risk profile: Moderately High. Risk profile: Moderately High. Risk profile: Moderately High. Risk profile: Moderately High. Risk profile: Moderately High. Point 5 5Y return: 16.94% (upper mid). 5Y return: 15.92% (bottom quartile). 5Y return: 16.74% (lower mid). 5Y return: 18.36% (top quartile). 5Y return: 12.35% (bottom quartile). Point 6 3Y return: 16.81% (top quartile). 3Y return: 16.63% (upper mid). 3Y return: 16.11% (lower mid). 3Y return: 16.06% (bottom quartile). 3Y return: 15.10% (bottom quartile). Point 7 1Y return: 8.26% (top quartile). 1Y return: 6.97% (lower mid). 1Y return: 4.30% (bottom quartile). 1Y return: 2.34% (bottom quartile). 1Y return: 7.53% (upper mid). Point 8 Alpha: 0.00 (bottom quartile). Alpha: 8.89 (upper mid). Alpha: 9.18 (top quartile). Alpha: 3.21 (lower mid). Alpha: 0.00 (bottom quartile). Point 9 Sharpe: 0.19 (bottom quartile). Sharpe: 0.25 (upper mid). Sharpe: 0.27 (top quartile). Sharpe: 0.02 (bottom quartile). Sharpe: 0.22 (lower mid). Point 10 Information ratio: 0.00 (top quartile). Information ratio: -0.17 (lower mid). Information ratio: -0.23 (bottom quartile). Information ratio: -0.27 (bottom quartile). Information ratio: 0.00 (upper mid). DSP Small Cap Fund
Sundaram Small Cap Fund
IDBI Small Cap Fund
Nippon India Small Cap Fund
Aditya Birla Sun Life Small Cap Fund
Best ELSS (Tax Saving Mutual Funds) for SIP
Fund NAV Net Assets (Cr) Min SIP Investment 3 MO (%) 6 MO (%) 1 YR (%) 3 YR (%) 5 YR (%) 2025 (%) IDBI Equity Advantage Fund Growth ₹43.39
↑ 0.04 ₹485 500 9.7 15.1 16.9 20.8 10 HDFC Long Term Advantage Fund Growth ₹595.168
↑ 0.28 ₹1,318 500 1.2 15.4 35.5 20.6 17.4 Motilal Oswal Long Term Equity Fund Growth ₹54.5313
↑ 0.05 ₹4,862 500 3.1 16 1.6 20.5 16.4 -9.1 Baroda Pioneer ELSS 96 Growth ₹68.6676
↑ 0.33 ₹210 500 -6.1 -3.5 17.6 16.7 11.6 SBI Magnum Tax Gain Fund Growth ₹431.718
↓ -0.73 ₹31,839 500 1.3 -0.6 -2.4 15.7 15.9 6.6 Note: Returns up to 1 year are on absolute basis & more than 1 year are on CAGR basis. as on 28 Jul 23 Research Highlights & Commentary of 5 Funds showcased
Commentary IDBI Equity Advantage Fund HDFC Long Term Advantage Fund Motilal Oswal Long Term Equity Fund Baroda Pioneer ELSS 96 SBI Magnum Tax Gain Fund Point 1 Bottom quartile AUM (₹485 Cr). Lower mid AUM (₹1,318 Cr). Upper mid AUM (₹4,862 Cr). Bottom quartile AUM (₹210 Cr). Highest AUM (₹31,839 Cr). Point 2 Established history (12+ yrs). Oldest track record among peers (25 yrs). Established history (11+ yrs). Established history (11+ yrs). Established history (19+ yrs). Point 3 Top rated. Rating: 3★ (upper mid). Not Rated. Not Rated. Rating: 2★ (lower mid). Point 4 Risk profile: Moderately High. Risk profile: Moderately High. Risk profile: Moderately High. Risk profile: Moderately High. Risk profile: Moderately High. Point 5 5Y return: 9.97% (bottom quartile). 5Y return: 17.39% (top quartile). 5Y return: 16.39% (upper mid). 5Y return: 11.62% (bottom quartile). 5Y return: 15.89% (lower mid). Point 6 3Y return: 20.84% (top quartile). 3Y return: 20.64% (upper mid). 3Y return: 20.49% (lower mid). 3Y return: 16.70% (bottom quartile). 3Y return: 15.75% (bottom quartile). Point 7 1Y return: 16.92% (lower mid). 1Y return: 35.51% (top quartile). 1Y return: 1.60% (bottom quartile). 1Y return: 17.56% (upper mid). 1Y return: -2.38% (bottom quartile). Point 8 Alpha: 1.78 (lower mid). Alpha: 1.75 (bottom quartile). Alpha: 6.27 (top quartile). Alpha: 5.69 (upper mid). Alpha: -0.28 (bottom quartile). Point 9 Sharpe: 1.21 (lower mid). Sharpe: 2.27 (upper mid). Sharpe: 0.02 (bottom quartile). Sharpe: 2.51 (top quartile). Sharpe: -0.36 (bottom quartile). Point 10 Information ratio: -1.13 (bottom quartile). Information ratio: -0.15 (bottom quartile). Information ratio: 0.76 (upper mid). Information ratio: -0.09 (lower mid). Information ratio: 1.29 (top quartile). IDBI Equity Advantage Fund
HDFC Long Term Advantage Fund
Motilal Oswal Long Term Equity Fund
Baroda Pioneer ELSS 96
SBI Magnum Tax Gain Fund
Best Sector Funds for SIP
Fund NAV Net Assets (Cr) Min SIP Investment 3 MO (%) 6 MO (%) 1 YR (%) 3 YR (%) 5 YR (%) 2025 (%) DSP Natural Resources and New Energy Fund Growth ₹105.996
↓ -0.62 ₹2,401 500 -4.2 4.3 16.4 19.6 15.8 17.5 BOI AXA Manufacturing and Infrastructure Fund Growth ₹65.94
↓ -0.02 ₹837 1,000 7.4 18.4 14.6 23 20.2 7.8 SBI Healthcare Opportunities Fund Growth ₹498.924
↓ -4.59 ₹4,998 500 15.2 23.7 13.3 22.7 16.1 -3.5 DSP India T.I.G.E.R Fund Growth ₹356.825
↓ -0.65 ₹6,264 500 4.9 20.1 12.6 22.4 21.7 -2.5 UTI Healthcare Fund Growth ₹326.047
↓ -0.67 ₹1,308 500 14.5 21.1 9.8 24 13.9 -3.1 Note: Returns up to 1 year are on absolute basis & more than 1 year are on CAGR basis. as on 23 Jul 26 Research Highlights & Commentary of 5 Funds showcased
Commentary DSP Natural Resources and New Energy Fund BOI AXA Manufacturing and Infrastructure Fund SBI Healthcare Opportunities Fund DSP India T.I.G.E.R Fund UTI Healthcare Fund Point 1 Lower mid AUM (₹2,401 Cr). Bottom quartile AUM (₹837 Cr). Upper mid AUM (₹4,998 Cr). Highest AUM (₹6,264 Cr). Bottom quartile AUM (₹1,308 Cr). Point 2 Established history (18+ yrs). Established history (16+ yrs). Established history (21+ yrs). Established history (22+ yrs). Oldest track record among peers (27 yrs). Point 3 Top rated. Not Rated. Rating: 2★ (lower mid). Rating: 4★ (upper mid). Rating: 1★ (bottom quartile). Point 4 Risk profile: High. Risk profile: High. Risk profile: High. Risk profile: High. Risk profile: High. Point 5 5Y return: 15.80% (bottom quartile). 5Y return: 20.24% (upper mid). 5Y return: 16.09% (lower mid). 5Y return: 21.69% (top quartile). 5Y return: 13.90% (bottom quartile). Point 6 3Y return: 19.57% (bottom quartile). 3Y return: 23.04% (upper mid). 3Y return: 22.67% (lower mid). 3Y return: 22.36% (bottom quartile). 3Y return: 23.98% (top quartile). Point 7 1Y return: 16.35% (top quartile). 1Y return: 14.58% (upper mid). 1Y return: 13.33% (lower mid). 1Y return: 12.56% (bottom quartile). 1Y return: 9.78% (bottom quartile). Point 8 Alpha: 0.00 (lower mid). Alpha: 0.00 (bottom quartile). Alpha: 2.23 (top quartile). Alpha: 0.00 (bottom quartile). Alpha: 2.15 (upper mid). Point 9 Sharpe: 0.72 (top quartile). Sharpe: 0.53 (bottom quartile). Sharpe: 0.59 (upper mid). Sharpe: 0.44 (bottom quartile). Sharpe: 0.58 (lower mid). Point 10 Information ratio: 0.00 (upper mid). Information ratio: 0.00 (lower mid). Information ratio: -0.17 (bottom quartile). Information ratio: 0.00 (bottom quartile). Information ratio: 0.20 (top quartile). DSP Natural Resources and New Energy Fund
BOI AXA Manufacturing and Infrastructure Fund
SBI Healthcare Opportunities Fund
DSP India T.I.G.E.R Fund
UTI Healthcare Fund
Best Focused Funds for SIP
Fund NAV Net Assets (Cr) Min SIP Investment 3 MO (%) 6 MO (%) 1 YR (%) 3 YR (%) 5 YR (%) 2025 (%) Sundaram Select Focus Fund Growth ₹264.968
↓ -1.18 ₹1,354 100 -5 8.5 24.5 17 17.3 ICICI Prudential Focused Equity Fund Growth ₹93.72
↓ -0.27 ₹17,012 100 3.2 0 2 16.9 16 15.4 HDFC Focused 30 Fund Growth ₹229.81
↓ -0.32 ₹27,303 300 2.4 -0.6 -0.2 15.5 18 10.9 SBI Focused Equity Fund Growth ₹388.973
↓ -5.82 ₹47,274 500 1.6 5.4 9.5 14.8 12.6 15.7 DSP Focus Fund Growth ₹54.329
↓ -0.03 ₹2,601 500 4 1.1 -1.5 13.5 10.4 7.3 Note: Returns up to 1 year are on absolute basis & more than 1 year are on CAGR basis. as on 24 Dec 21 Research Highlights & Commentary of 5 Funds showcased
Commentary Sundaram Select Focus Fund ICICI Prudential Focused Equity Fund HDFC Focused 30 Fund SBI Focused Equity Fund DSP Focus Fund Point 1 Bottom quartile AUM (₹1,354 Cr). Lower mid AUM (₹17,012 Cr). Upper mid AUM (₹27,303 Cr). Highest AUM (₹47,274 Cr). Bottom quartile AUM (₹2,601 Cr). Point 2 Oldest track record among peers (24 yrs). Established history (17+ yrs). Established history (21+ yrs). Established history (21+ yrs). Established history (16+ yrs). Point 3 Top rated. Rating: 2★ (bottom quartile). Rating: 3★ (upper mid). Rating: 2★ (bottom quartile). Rating: 3★ (lower mid). Point 4 Risk profile: Moderately High. Risk profile: Moderately High. Risk profile: Moderately High. Risk profile: Moderately High. Risk profile: Moderately High. Point 5 5Y return: 17.29% (upper mid). 5Y return: 16.02% (lower mid). 5Y return: 17.95% (top quartile). 5Y return: 12.55% (bottom quartile). 5Y return: 10.40% (bottom quartile). Point 6 3Y return: 17.03% (top quartile). 3Y return: 16.89% (upper mid). 3Y return: 15.54% (lower mid). 3Y return: 14.81% (bottom quartile). 3Y return: 13.46% (bottom quartile). Point 7 1Y return: 24.49% (top quartile). 1Y return: 2.00% (lower mid). 1Y return: -0.22% (bottom quartile). 1Y return: 9.48% (upper mid). 1Y return: -1.48% (bottom quartile). Point 8 Alpha: -5.62 (bottom quartile). Alpha: 2.26 (upper mid). Alpha: -0.27 (bottom quartile). Alpha: 10.04 (top quartile). Alpha: 0.68 (lower mid). Point 9 Sharpe: 1.85 (top quartile). Sharpe: -0.20 (lower mid). Sharpe: -0.32 (bottom quartile). Sharpe: 0.18 (upper mid). Sharpe: -0.27 (bottom quartile). Point 10 Information ratio: -0.52 (bottom quartile). Information ratio: 1.27 (top quartile). Information ratio: 0.67 (upper mid). Information ratio: 0.49 (lower mid). Information ratio: 0.39 (bottom quartile). Sundaram Select Focus Fund
ICICI Prudential Focused Equity Fund
HDFC Focused 30 Fund
SBI Focused Equity Fund
DSP Focus Fund
Best Value Funds for SIP
Fund NAV Net Assets (Cr) Min SIP Investment 3 MO (%) 6 MO (%) 1 YR (%) 3 YR (%) 5 YR (%) 2025 (%) HDFC Capital Builder Value Fund Growth ₹770.926
↓ -0.11 ₹7,583 300 3.6 4 3.2 15.7 14.3 8.6 Aditya Birla Sun Life Pure Value Fund Growth ₹133.346
↓ -0.04 ₹6,603 1,000 4.1 8 6.7 15.6 14 2.6 Nippon India Value Fund Growth ₹221.6
↓ -0.13 ₹8,962 100 -0.2 -0.8 -2.6 15.1 14.4 4.2 ICICI Prudential Value Discovery Fund Growth ₹456.83
↓ -0.44 ₹60,198 100 -0.2 -5 -2.7 13.5 16 13.8 UTI Value Opportunities Fund Growth ₹164.174
↓ -0.20 ₹9,440 500 1.9 -2 -3.3 13.1 11.9 7 Note: Returns up to 1 year are on absolute basis & more than 1 year are on CAGR basis. as on 24 Jul 26 Research Highlights & Commentary of 5 Funds showcased
Commentary HDFC Capital Builder Value Fund Aditya Birla Sun Life Pure Value Fund Nippon India Value Fund ICICI Prudential Value Discovery Fund UTI Value Opportunities Fund Point 1 Bottom quartile AUM (₹7,583 Cr). Bottom quartile AUM (₹6,603 Cr). Lower mid AUM (₹8,962 Cr). Highest AUM (₹60,198 Cr). Upper mid AUM (₹9,440 Cr). Point 2 Oldest track record among peers (32 yrs). Established history (18+ yrs). Established history (21+ yrs). Established history (21+ yrs). Established history (21+ yrs). Point 3 Top rated. Rating: 3★ (upper mid). Not Rated. Rating: 2★ (lower mid). Rating: 1★ (bottom quartile). Point 4 Risk profile: Moderately High. Risk profile: Moderately High. Risk profile: Moderately High. Risk profile: Moderately High. Risk profile: Moderately High. Point 5 5Y return: 14.27% (lower mid). 5Y return: 14.02% (bottom quartile). 5Y return: 14.37% (upper mid). 5Y return: 15.95% (top quartile). 5Y return: 11.88% (bottom quartile). Point 6 3Y return: 15.67% (top quartile). 3Y return: 15.63% (upper mid). 3Y return: 15.11% (lower mid). 3Y return: 13.53% (bottom quartile). 3Y return: 13.11% (bottom quartile). Point 7 1Y return: 3.17% (upper mid). 1Y return: 6.71% (top quartile). 1Y return: -2.62% (lower mid). 1Y return: -2.74% (bottom quartile). 1Y return: -3.28% (bottom quartile). Point 8 Alpha: 3.42 (upper mid). Alpha: 6.28 (top quartile). Alpha: -0.61 (lower mid). Alpha: -3.68 (bottom quartile). Alpha: -3.38 (bottom quartile). Point 9 Sharpe: -0.13 (upper mid). Sharpe: 0.01 (top quartile). Sharpe: -0.36 (lower mid). Sharpe: -0.58 (bottom quartile). Sharpe: -0.53 (bottom quartile). Point 10 Information ratio: 1.47 (top quartile). Information ratio: 0.70 (lower mid). Information ratio: 1.12 (upper mid). Information ratio: 0.38 (bottom quartile). Information ratio: 0.27 (bottom quartile). HDFC Capital Builder Value Fund
Aditya Birla Sun Life Pure Value Fund
Nippon India Value Fund
ICICI Prudential Value Discovery Fund
UTI Value Opportunities Fund
SIP Calculator
SIP calculator is one of the efficient tools an investor can use while investing in mutual funds. Whether one wants to invest to buy a car/house, plan for retirement, a child's higher education or any other asset, the SIP calculator can be used for the same. It helps to calculate the amount of investment and time period that is required for investing to reach the particular financial goal. So, common questions like "how much to invest in a SIP or how till that time should I invest", resolves using this calculator.
When using a SIP calculator, one has to fill certain variables, that include (illustration is given below)-
- The desired investment duration
- The estimated monthly SIP amount
- Expected inflation rate (annual) for the years to come
- Long-term growth rate on investments
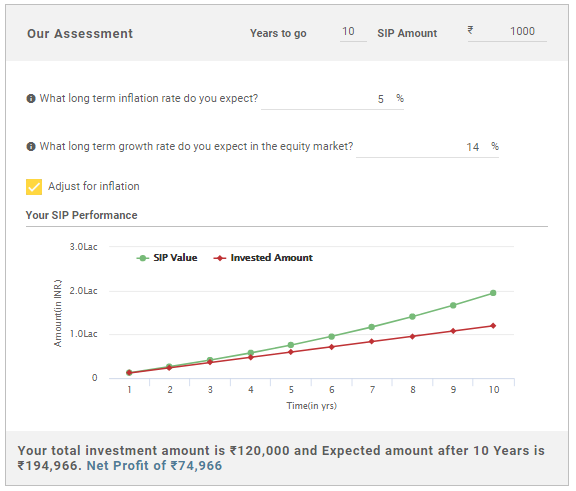
Once you feed all the above-mentioned information, the calculator will end up giving you the amount you will receive (your SIP returns) after the number of years mentioned. Your net profit will be highlighted as well so that you can estimate your goal fulfilment accordingly.
How to Invest in Best Mutual Funds?
Open Free Investment Account for Lifetime at Fincash.com.
Complete your Registration and KYC Process
Upload Documents (PAN, Aadhaar, etc.). And, You are Ready to Invest!
All efforts have been made to ensure the information provided here is accurate. However, no guarantees are made regarding correctness of data. Please verify with scheme information document before making any investment.


AMFI Registration No. 112358 | CIN: U74999MH2016PTC282153
Shepard Technologies Pvt. Ltd. (with ARN code 112358) makes no warranties or representations, express or implied, on products offered through the platform. It accepts no liability for any damages or losses, however caused, in connection with the use of, or on the reliance of its product or related services. Terms and conditions of the website are applicable.
©2026 Shepard Technologies Private Limited. All Rights Reserved