سرمایہ کاری کرکے 1 کروڑ کیسے حاصل کریں۔
ماہانہ میوچل فنڈز SIP کے ذریعے سرمایہ کاری کرنا
سرمایہ کاری ایکویٹی میوچل فنڈ اسکیم میں ایک کے ذریعےگھونٹ آپ کے طویل مدتی اہداف کو حاصل کرنے کا بہترین طریقہ ہے۔ ایکویٹی میں دیگر اثاثوں کی کلاسوں کے مقابلے اعلیٰ منافع کی پیشکش کی صلاحیت ہے۔ اس سے آپ کو شکست دینے میں بھی مدد مل سکتی ہے۔مہنگائی جو طویل مدتی اہداف کے حصول کے لیے ضروری ہے۔ وہ سازگار ٹیکس سے بھی لطف اندوز ہوتے ہیں۔ اب، طویل مدتیسرمایہ ایک سال سے زیادہ کی سرمایہ کاری پر ٹیکس سے پاک تھا (مالی سال 18-19 کے یونین بجٹ سے یکم فروری سے 1 لاکھ سے زیادہ کے منافع پر 10% ٹیکس لگے گا یعنی اگر کسی کو طویل مدتی میں ایک مالی سال میں 1.1 لاکھ کا فائدہ ہوتا ہے۔کیپٹل گینز اسے 1,10 پر ٹیکس ادا کرنا ہوگا،000 - 1,00,000 = 10,000۔ 10% پر 10,000 = 1,000 انچٹیکس)۔
Talk to our investment specialist
1 کروڑ کیسے حاصل کریں؟
ذیل میں مختلف ٹائم فریموں میں 1 کروڑ حاصل کرنے کے طریقے کی مثالیں ہیں۔SIP میں سرمایہ کاری (منظمسرمایہ کاری کا منصوبہ) کابہترین باہمی فنڈز.
1. 20 سالوں میں 1 کروڑ کیسے حاصل کریں۔
Mutual Funds SIP کے ذریعے روپے کی سرمایہ کاری شروع کریں۔ 7,600 فی مہینہ
اگر آپ ہر ماہ 7,600 روپے بچا سکتے ہیں تو فوری طور پر ایس آئی پی شروع کریں۔ایکویٹی میوچل فنڈز. اگر آپ کو اسکیموں کے انتخاب میں مدد کی ضرورت ہے، تو آپ ہمارے تجویز کردہ ایکویٹی میوچل فنڈ پورٹ فولیوز کو چیک کر سکتے ہیں اور اپنی بنیاد پر ایک پورٹ فولیو چن سکتے ہیں۔خطرے کی بھوک اور SIP کی رقم۔ اگر آپ کا پورٹ فولیوباہمی چندہ 14 فیصد سالانہ ریٹرن پیش کرنے کا انتظام کرتا ہے (جو اس سے کم ہے۔سی اے جی آر 1979 میں آغاز کے بعد سے SENSEX کی طرف سے پیش کردہ)، آپ 20 سالوں میں 1 کروڑ روپے کا کارپس بنانے کے قابل ہو جائیں گے جیسا کہ ذیل میں دکھایا گیا ہے۔
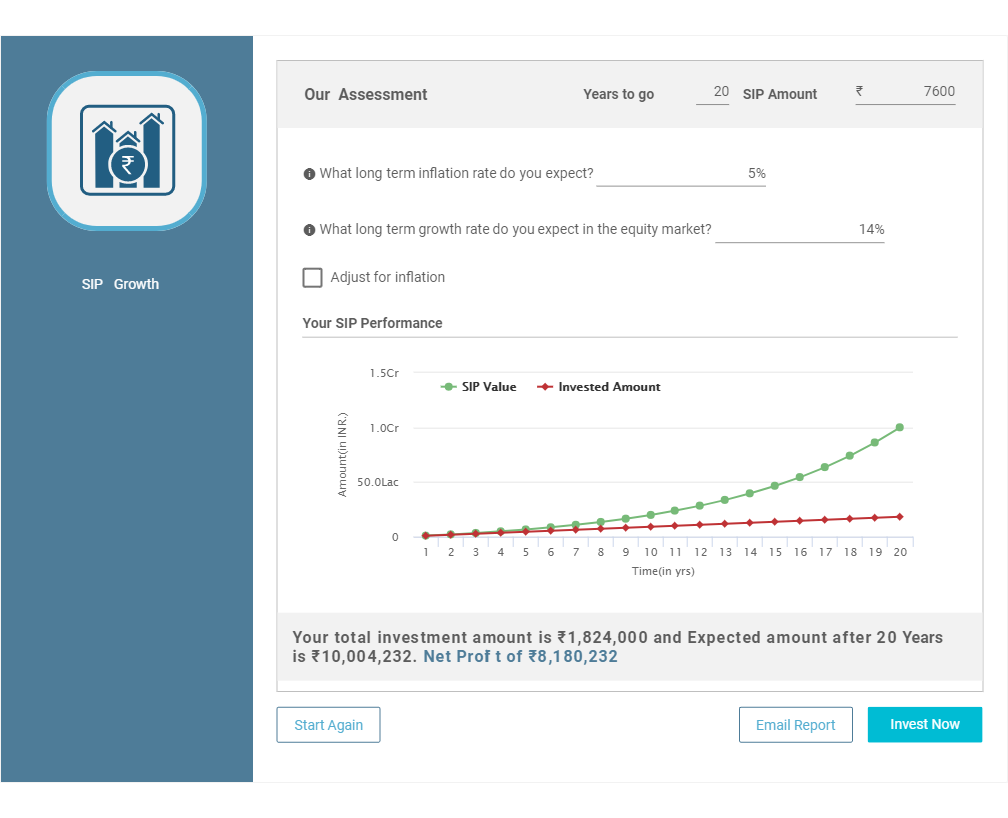
تاریخی واپسیوں پر مبنی کلیدی مفروضہ ذیل میں ہیں۔
| مفروضے | ڈیٹا |
|---|---|
| اضافے کی شرح | 14% |
| مہنگائی | فیکٹرڈ نہیں |
| سرمایہ کاری کی رقم (pm) | 7,600 |
| وقت کی مدت | 20 سال |
| سرمایہ کاری کی گئی رقم | 18,24,000 |
| کل کارپس | 1,00,04,232 |
| نیٹ حاصلات | 81,80,232 |
مزید تفصیلات ہمارا استعمال کرتے ہوئے کام کیا جا سکتا ہےگھونٹ کیلکولیٹر نیچے والے بٹن پر کلک کرکے
2. 15 سالوں میں 1 کروڑ کیسے حاصل کریں۔
Mutual Funds SIP کے ذریعے روپے کی سرمایہ کاری شروع کریں۔ 16,320 فی مہینہ
اگر آپ ہر ماہ 16,320 روپے بچا سکتے ہیں تو ایکویٹی میوچل فنڈز میں فوری طور پر ایک SIP شروع کریں۔ اگر آپ کو اسکیموں کے انتخاب میں مدد کی ضرورت ہے تو، آپ ہمارے تجویز کردہ ایکویٹی میوچل فنڈ پورٹ فولیوز کو چیک کر سکتے ہیں اور اپنی خطرے کی بھوک اور SIP رقم کی بنیاد پر ایک پورٹ فولیو منتخب کر سکتے ہیں۔ اگر آپ کا میوچل فنڈز کا پورٹ فولیو 14 فیصد سالانہ ریٹرن پیش کرنے کا انتظام کرتا ہے (جو 1979 میں SENSEX کے آغاز سے پیش کردہ CAGR سے کم ہے)، تو آپ 15 سالوں میں 1 کروڑ روپے کا کارپس بنا سکیں گے جیسا کہ ذیل میں دکھایا گیا ہے۔
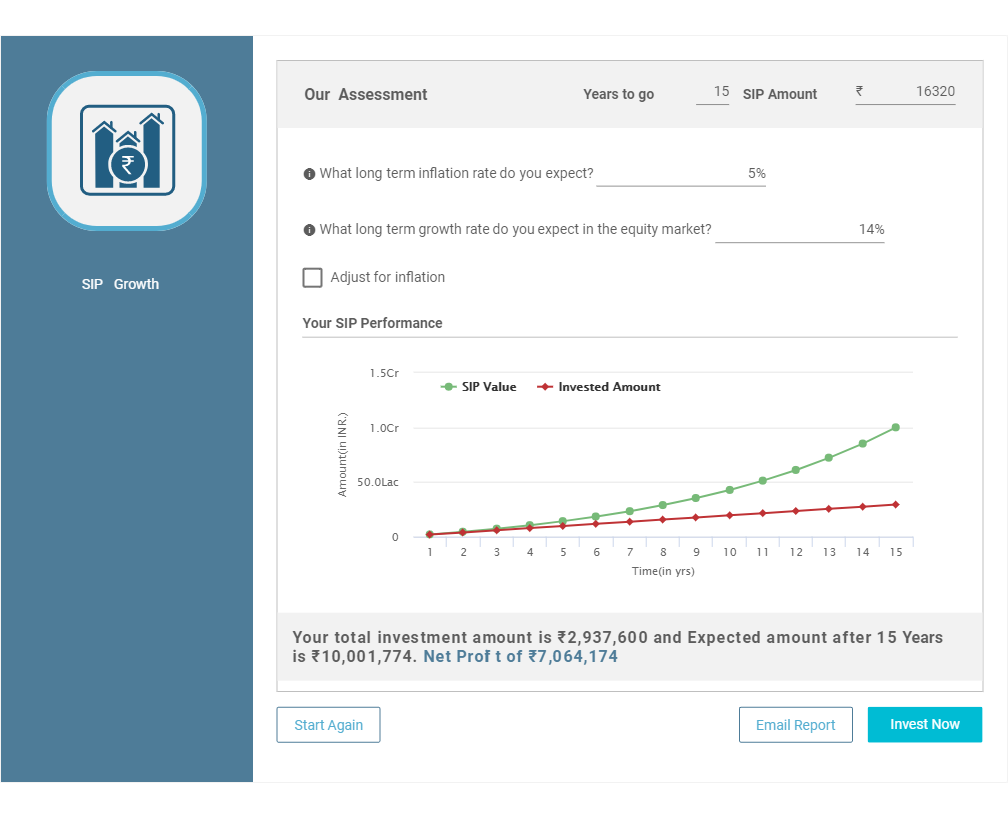
تاریخی واپسیوں پر مبنی کلیدی مفروضہ ذیل میں ہیں۔
| مفروضے | ڈیٹا |
|---|---|
| اضافے کی شرح | 14% |
| مہنگائی | فیکٹرڈ نہیں |
| سرمایہ کاری کی رقم (pm) | 16,320 |
| وقت کی مدت | 15 سال |
| سرمایہ کاری کی گئی رقم | 29,37,600 |
| کل کارپس | 1,00,01,774 |
| نیٹ حاصلات | 70,64,174 |
ذیل کے بٹن پر کلک کر کے ہمارے SIP کیلکولیٹر کا استعمال کرتے ہوئے مزید تفصیلات پر کام کیا جا سکتا ہے۔
3. 10 سالوں میں 1 کروڑ کیسے حاصل کریں۔
Mutual Funds SIP کے ذریعے روپے کی سرمایہ کاری شروع کریں۔ 38,160 فی مہینہ
اگر آپ ہر ماہ 38,160 روپے بچا سکتے ہیں تو ایکویٹی میوچل فنڈز میں فوری طور پر ایک SIP شروع کریں۔ اگر آپ کو اسکیموں کے انتخاب میں مدد کی ضرورت ہے تو، آپ ہمارے تجویز کردہ ایکویٹی میوچل فنڈ پورٹ فولیوز کو چیک کر سکتے ہیں اور اپنی خطرے کی بھوک اور SIP رقم کی بنیاد پر ایک پورٹ فولیو منتخب کر سکتے ہیں۔ اگر آپ کا میوچل فنڈز کا پورٹ فولیو 14 فیصد سالانہ ریٹرن پیش کرنے کا انتظام کرتا ہے (جو کہ 1979 میں SENSEX کی طرف سے پیش کردہ CAGR سے کم ہے)، تو آپ 10 سالوں میں 1 کروڑ روپے کا کارپس بنا سکیں گے جیسا کہ ذیل میں دکھایا گیا ہے۔
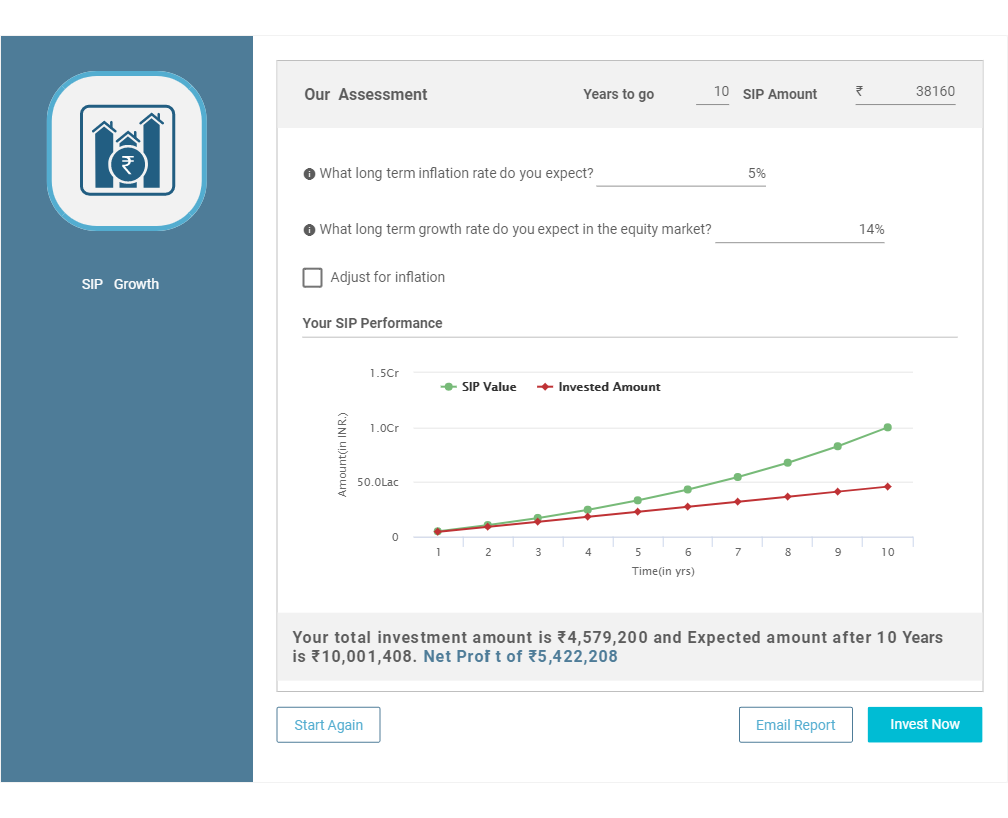
تاریخی واپسیوں پر مبنی کلیدی مفروضہ ذیل میں ہیں۔
| مفروضے | ڈیٹا |
|---|---|
| اضافے کی شرح | 14% |
| مہنگائی | فیکٹرڈ نہیں |
| سرمایہ کاری کی رقم (pm) | 38,160 |
| وقت کی مدت | 10 سال |
| سرمایہ کاری کی گئی رقم | 45,79,200 |
| کل کارپس | 1,00,01,408 |
| نیٹ حاصلات | 54,22,208 |
| ذیل کے بٹن پر کلک کر کے ہمارے SIP کیلکولیٹر کا استعمال کرتے ہوئے مزید تفصیلات پر کام کیا جا سکتا ہے۔ |
سرفہرست 10 بہترین کارکردگی کا مظاہرہ کرنے والے SIP میوچل فنڈز
ذیل میں بہترین میوچل فنڈز کی فہرست دی گئی ہے جن کے اوپر خالص اثاثے/AUM ہیں۔500 کروڑ اور ترتیب دیا گیا5 سالہ CAGR ریٹرن. جس میں دیے گئے مقصد کو حاصل کرنے کے لیے سرمایہ کاری کی تلاش کی جا سکتی ہے۔
To generate capital appreciation and income distribution to unit holders by investing predominantly in equity/equity related securities of the companies belonging to the infrastructure development and balance in debt securities and money market instruments. Below is the key information for ICICI Prudential Infrastructure Fund Returns up to 1 year are on The objective of the scheme would be to provide investors with opportunities for long-term growth in capital along with the liquidity of an open-ended scheme through an active management of investments in a diversified basket of equity stocks of domestic Public Sector Undertakings and in debt and money market instruments issued by PSUs AND others. Research Highlights for SBI PSU Fund Below is the key information for SBI PSU Fund Returns up to 1 year are on "The primary investment objective of the Scheme is to seek capital appreciation by investing predominantly in units of MLIIF - WGF. The Scheme may, at the discretion of the Investment Manager, also invest in the units of other similar overseas mutual fund schemes, which may constitute a significant part of its corpus. The Scheme may also invest a certain portion of its corpus in money market securities and/or units of money market/liquid schemes of DSP Merrill Lynch Mutual Fund, in order to meet liquidity requirements from time to time. However, there is no assurance that the investment objective of the Scheme will be realized." Research Highlights for DSP World Gold Fund Below is the key information for DSP World Gold Fund Returns up to 1 year are on The investment objective of the scheme is to provide long term growth from a portfolio of equity / equity related instruments of companies engaged either directly or indirectly in the infrastructure sector. Research Highlights for LIC MF Infrastructure Fund Below is the key information for LIC MF Infrastructure Fund Returns up to 1 year are on (Erstwhile Motilal Oswal MOSt Focused Midcap 30 Fund) The investment objective of the Scheme is to achieve long term capital appreciation by investing in a maximum of 30 quality mid-cap companies having long-term competitive advantages and potential for growth. However, there can be no assurance or guarantee that the investment objective of the Scheme would be achieved. Research Highlights for Motilal Oswal Midcap 30 Fund Below is the key information for Motilal Oswal Midcap 30 Fund Returns up to 1 year are on (Erstwhile Reliance Diversified Power Sector Fund) The primary investment objective of the scheme is to generate long term capital appreciation by investing predominantly in equity and equity related securities of companies in the power sector. Research Highlights for Nippon India Power and Infra Fund Below is the key information for Nippon India Power and Infra Fund Returns up to 1 year are on To generate capital appreciation, from a portfolio that is substantially constituted of equity securities and equity related securities of corporates, which could benefit from structural changes brought about by continuing liberalization in economic policies by the government and/or continuing investments in infrastructure, both by the public and private sector. Research Highlights for DSP India T.I.G.E.R Fund Below is the key information for DSP India T.I.G.E.R Fund Returns up to 1 year are on To generate capital appreciation by investing in Equity and Equity Related Instruments of companies where the Central / State Government(s) has majority shareholding or management control or has powers to appoint majority of directors. However, there is no assurance or guarantee that the investment objective of the Scheme will be achieved. The Scheme does not assure or guarantee any returns. Research Highlights for Invesco India PSU Equity Fund Below is the key information for Invesco India PSU Equity Fund Returns up to 1 year are on The Scheme seeks to generate long term capital appreciation through a portfolio of predominantly equity and equity related securities of companies engaged in manufacturing and infrastructure and related sectors. Further, there can be no assurance that the investment objectives of the scheme will be realized. The Scheme is not providing any assured or guaranteed returns Research Highlights for BOI AXA Manufacturing and Infrastructure Fund Below is the key information for BOI AXA Manufacturing and Infrastructure Fund Returns up to 1 year are on Investment Objective is “capital appreciation” through investments in stocks of the companies engaged in the transportation and logistics sector. Research Highlights for UTI Transportation & Logistics Fund Below is the key information for UTI Transportation & Logistics Fund Returns up to 1 year are on 1. ICICI Prudential Infrastructure Fund
ICICI Prudential Infrastructure Fund
Growth Launch Date 31 Aug 05 NAV (29 Jul 26) ₹202.13 ↑ 1.69 (0.84 %) Net Assets (Cr) ₹8,550 on 30 Jun 26 Category Equity - Sectoral AMC ICICI Prudential Asset Management Company Limited Rating ☆☆☆ Risk High Expense Ratio 1.89 Sharpe Ratio -0.07 Information Ratio 0 Alpha Ratio 0 Min Investment 5,000 Min SIP Investment 100 Exit Load 0-1 Years (1%),1 Years and above(NIL) Growth of 10,000 investment over the years.
Date Value 30 Jun 21 ₹10,000 30 Jun 22 ₹11,534 30 Jun 23 ₹16,346 30 Jun 24 ₹27,296 30 Jun 25 ₹28,743 30 Jun 26 ₹29,425 Returns for ICICI Prudential Infrastructure Fund
absolute basis & more than 1 year are on CAGR (Compound Annual Growth Rate) basis. as on 29 Jul 26 Duration Returns 1 Month -0.7% 3 Month 0.2% 6 Month 5.6% 1 Year 3.9% 3 Year 18.9% 5 Year 22.9% 10 Year 15 Year Since launch 15.5% Historical performance (Yearly) on absolute basis
Year Returns 2025 6.7% 2024 27.4% 2023 44.6% 2022 28.8% 2021 50.1% 2020 3.6% 2019 2.6% 2018 -14% 2017 40.8% 2016 2% Fund Manager information for ICICI Prudential Infrastructure Fund
Name Since Tenure Ihab Dalwai 3 Jun 17 9.08 Yr. Sharmila D’mello 30 Jun 22 4.01 Yr. Data below for ICICI Prudential Infrastructure Fund as on 30 Jun 26
Equity Sector Allocation
Sector Value Industrials 47.57% Financial Services 10.57% Utility 10.32% Basic Materials 9.74% Real Estate 8.09% Energy 5.04% Consumer Cyclical 1.98% Communication Services 0.09% Asset Allocation
Asset Class Value Cash 5.83% Equity 94.17% Top Securities Holdings / Portfolio
Name Holding Value Quantity InterGlobe Aviation Ltd (Industrials)
Equity, Since 28 Feb 23 | INDIGO9% ₹745 Cr 1,691,985
↑ 50,000 Larsen & Toubro Ltd (Industrials)
Equity, Since 30 Nov 09 | LT7% ₹614 Cr 1,505,704 Oberoi Realty Ltd (Real Estate)
Equity, Since 31 May 23 | OBEROIRLTY4% ₹365 Cr 2,139,426 Gujarat Energy Ltd (Utilities)
Equity, Since 31 Jan 23 | GUJGASLTD4% ₹340 Cr 8,482,024
↑ 156,557 NTPC Ltd (Utilities)
Equity, Since 29 Feb 16 | NTPC4% ₹334 Cr 8,626,448 Shree Cement Ltd (Basic Materials)
Equity, Since 30 Apr 24 | SHREECEM3% ₹270 Cr 106,892
↑ 3,387 Kalpataru Projects International Ltd (Industrials)
Equity, Since 30 Sep 06 | KPIL3% ₹262 Cr 2,005,608 AIA Engineering Ltd (Industrials)
Equity, Since 28 Feb 21 | AIAENG3% ₹258 Cr 572,697 HDFC Bank Ltd (Financial Services)
Equity, Since 31 Jan 22 | HDFCBANK3% ₹250 Cr 3,357,506
↑ 1,057,506 Container Corporation of India Ltd (Industrials)
Equity, Since 31 Jan 16 | CONCOR3% ₹227 Cr 4,885,153 2. SBI PSU Fund
SBI PSU Fund
Growth Launch Date 7 Jul 10 NAV (29 Jul 26) ₹34.0268 ↑ 0.03 (0.10 %) Net Assets (Cr) ₹6,684 on 30 Jun 26 Category Equity - Sectoral AMC SBI Funds Management Private Limited Rating ☆☆ Risk High Expense Ratio 1.89 Sharpe Ratio 0.12 Information Ratio -0.11 Alpha Ratio -0.3 Min Investment 5,000 Min SIP Investment 500 Exit Load 0-1 Years (1%),1 Years and above(NIL) Growth of 10,000 investment over the years.
Date Value 30 Jun 21 ₹10,000 30 Jun 22 ₹9,973 30 Jun 23 ₹13,609 30 Jun 24 ₹26,792 30 Jun 25 ₹26,602 30 Jun 26 ₹28,255 Returns for SBI PSU Fund
absolute basis & more than 1 year are on CAGR (Compound Annual Growth Rate) basis. as on 29 Jul 26 Duration Returns 1 Month -1.8% 3 Month -6.4% 6 Month -3.2% 1 Year 7.7% 3 Year 22.6% 5 Year 22.6% 10 Year 15 Year Since launch 7.9% Historical performance (Yearly) on absolute basis
Year Returns 2025 11.3% 2024 23.5% 2023 54% 2022 29% 2021 32.4% 2020 -10% 2019 6% 2018 -23.8% 2017 21.9% 2016 16.2% Fund Manager information for SBI PSU Fund
Name Since Tenure Rohit Shimpi 1 Jun 24 2.08 Yr. Data below for SBI PSU Fund as on 30 Jun 26
Equity Sector Allocation
Sector Value Financial Services 32.54% Utility 31.22% Industrials 14.07% Energy 11.97% Basic Materials 6.94% Asset Allocation
Asset Class Value Cash 3.18% Equity 96.74% Debt 0.07% Top Securities Holdings / Portfolio
Name Holding Value Quantity State Bank of India (Financial Services)
Equity, Since 31 Jul 10 | SBIN17% ₹1,112 Cr 11,527,500
↑ 1,000,000 GAIL (India) Ltd (Utilities)
Equity, Since 31 May 24 | GAIL10% ₹628 Cr 38,150,000 NTPC Ltd (Utilities)
Equity, Since 31 Jul 10 | NTPC9% ₹597 Cr 15,443,244 Bharat Electronics Ltd (Industrials)
Equity, Since 30 Jun 24 | BEL9% ₹583 Cr 14,185,000
↑ 800,000 Power Grid Corp Of India Ltd (Utilities)
Equity, Since 31 Jul 10 | POWERGRID9% ₹579 Cr 19,935,554 Oil & Natural Gas Corp Ltd (Energy)
Equity, Since 31 May 20 | ONGC6% ₹389 Cr 14,655,000 Bank of Baroda (Financial Services)
Equity, Since 31 Aug 24 | BANKBARODA5% ₹352 Cr 13,100,000 Bharat Petroleum Corp Ltd (Energy)
Equity, Since 31 Aug 24 | BPCL4% ₹289 Cr 9,700,000 Bharat Heavy Electricals Ltd (Industrials)
Equity, Since 30 Jun 25 | BHEL4% ₹271 Cr 6,500,000 NMDC Ltd (Basic Materials)
Equity, Since 31 Oct 23 | NMDC4% ₹245 Cr 27,900,000 3. DSP World Gold Fund
DSP World Gold Fund
Growth Launch Date 14 Sep 07 NAV (28 Jul 26) ₹49.2082 ↓ -1.38 (-2.74 %) Net Assets (Cr) ₹1,433 on 30 Jun 26 Category Equity - Global AMC DSP BlackRock Invmt Managers Pvt. Ltd. Rating ☆☆☆ Risk High Expense Ratio 1.41 Sharpe Ratio 1.22 Information Ratio -0.5 Alpha Ratio 2.12 Min Investment 1,000 Min SIP Investment 500 Exit Load 0-12 Months (1%),12 Months and above(NIL) Growth of 10,000 investment over the years.
Date Value 30 Jun 21 ₹10,000 30 Jun 22 ₹8,181 30 Jun 23 ₹9,294 30 Jun 24 ₹10,640 30 Jun 25 ₹16,808 30 Jun 26 ₹27,693 Returns for DSP World Gold Fund
absolute basis & more than 1 year are on CAGR (Compound Annual Growth Rate) basis. as on 29 Jul 26 Duration Returns 1 Month 0.1% 3 Month -15.4% 6 Month -28.8% 1 Year 60.5% 3 Year 42.5% 5 Year 22.5% 10 Year 15 Year Since launch 8.8% Historical performance (Yearly) on absolute basis
Year Returns 2025 167.1% 2024 15.9% 2023 7% 2022 -7.7% 2021 -9% 2020 31.4% 2019 35.1% 2018 -10.7% 2017 -4% 2016 52.7% Fund Manager information for DSP World Gold Fund
Name Since Tenure Kaivalya Nadkarni 1 May 25 1.17 Yr. Data below for DSP World Gold Fund as on 30 Jun 26
Equity Sector Allocation
Sector Value Basic Materials 94.47% Asset Allocation
Asset Class Value Cash 3.62% Equity 94.47% Debt 0% Other 1.91% Top Securities Holdings / Portfolio
Name Holding Value Quantity BGF World Gold I2
Investment Fund | -68% ₹1,141 Cr 1,005,044 VanEck Gold Miners ETF
- | GDX29% ₹490 Cr 573,719 Treps / Reverse Repo Investments
CBLO/Reverse Repo | -3% ₹54 Cr Net Receivables/Payables
Net Current Assets | -0% -₹6 Cr 4. LIC MF Infrastructure Fund
LIC MF Infrastructure Fund
Growth Launch Date 29 Feb 08 NAV (29 Jul 26) ₹53.7383 ↑ 0.15 (0.28 %) Net Assets (Cr) ₹1,137 on 30 Jun 26 Category Equity - Sectoral AMC LIC Mutual Fund Asset Mgmt Co Ltd Rating Risk High Expense Ratio 2.21 Sharpe Ratio 0.22 Information Ratio 0.58 Alpha Ratio 8.41 Min Investment 5,000 Min SIP Investment 1,000 Exit Load 0-1 Years (1%),1 Years and above(NIL) Growth of 10,000 investment over the years.
Date Value 30 Jun 21 ₹10,000 30 Jun 22 ₹11,137 30 Jun 23 ₹14,179 30 Jun 24 ₹26,268 30 Jun 25 ₹26,896 30 Jun 26 ₹29,151 Returns for LIC MF Infrastructure Fund
absolute basis & more than 1 year are on CAGR (Compound Annual Growth Rate) basis. as on 29 Jul 26 Duration Returns 1 Month -2.1% 3 Month 3.1% 6 Month 14.1% 1 Year 8.7% 3 Year 24.4% 5 Year 22% 10 Year 15 Year Since launch 9.6% Historical performance (Yearly) on absolute basis
Year Returns 2025 -3.7% 2024 47.8% 2023 44.4% 2022 7.9% 2021 46.6% 2020 -0.1% 2019 13.3% 2018 -14.6% 2017 42.2% 2016 -2.2% Fund Manager information for LIC MF Infrastructure Fund
Name Since Tenure Sumit Bhatnagar 7 Apr 26 0.23 Yr. Mahesh Bendre 1 Jul 24 2 Yr. Data below for LIC MF Infrastructure Fund as on 30 Jun 26
Equity Sector Allocation
Sector Value Industrials 37.05% Consumer Cyclical 20.88% Basic Materials 12.42% Utility 11.88% Communication Services 5.02% Financial Services 3.98% Real Estate 1.97% Health Care 1.89% Technology 1.08% Asset Allocation
Asset Class Value Cash 3.82% Equity 96.18% Top Securities Holdings / Portfolio
Name Holding Value Quantity Larsen & Toubro Ltd (Industrials)
Equity, Since 30 Apr 09 | LT4% ₹44 Cr 106,968
↓ -10,884 Garware Hi-Tech Films Ltd (Basic Materials)
Equity, Since 31 Aug 23 | 5006554% ₹40 Cr 65,325
↓ -7,684 Tata Motors Passenger Vehicles Ltd (Consumer Cyclical)
Equity, Since 28 Feb 26 | TMPV4% ₹39 Cr 982,891
↓ -332,760 Tata Motors Ltd (Consumer Cyclical)
Equity, Since 31 Oct 25 | TMCV4% ₹39 Cr 1,015,933
↑ 26,983 Tata Power Co Ltd (Utilities)
Equity, Since 29 Feb 24 | TATAPOWER3% ₹36 Cr 861,040
↑ 524,312 KSH International Ltd (Industrials)
Equity, Since 31 Dec 25 | KSHINTL3% ₹34 Cr 432,816
↑ 6,280 Siemens Energy India Ltd (Utilities)
Equity, Since 31 Aug 25 | ENRIN3% ₹34 Cr 87,106
↑ 24,800 JSW Infrastructure Ltd (Industrials)
Equity, Since 30 Apr 26 | JSWINFRA3% ₹31 Cr 1,133,858
↑ 745,681 Carraro India Ltd (Consumer Cyclical)
Equity, Since 31 Dec 24 | CARRARO3% ₹31 Cr 572,991 Bharat Dynamics Ltd Ordinary Shares (Industrials)
Equity, Since 31 Jan 26 | BDL3% ₹29 Cr 242,954
↑ 157,744 5. Motilal Oswal Midcap 30 Fund
Motilal Oswal Midcap 30 Fund
Growth Launch Date 24 Feb 14 NAV (29 Jul 26) ₹100.335 ↑ 0.90 (0.90 %) Net Assets (Cr) ₹37,474 on 30 Jun 26 Category Equity - Mid Cap AMC Motilal Oswal Asset Management Co. Ltd Rating ☆☆☆ Risk Moderately High Expense Ratio 1.56 Sharpe Ratio -0.71 Information Ratio -0.25 Alpha Ratio -14.72 Min Investment 5,000 Min SIP Investment 500 Exit Load 0-1 Years (1%),1 Years and above(NIL) Growth of 10,000 investment over the years.
Date Value 30 Jun 21 ₹10,000 30 Jun 22 ₹11,908 30 Jun 23 ₹16,418 30 Jun 24 ₹26,938 30 Jun 25 ₹29,503 30 Jun 26 ₹26,510 Returns for Motilal Oswal Midcap 30 Fund
absolute basis & more than 1 year are on CAGR (Compound Annual Growth Rate) basis. as on 29 Jul 26 Duration Returns 1 Month 7.4% 3 Month 9.3% 6 Month 8.3% 1 Year -1.2% 3 Year 19.3% 5 Year 21.9% 10 Year 15 Year Since launch 20.4% Historical performance (Yearly) on absolute basis
Year Returns 2025 -12.1% 2024 57.1% 2023 41.7% 2022 10.7% 2021 55.8% 2020 9.3% 2019 9.7% 2018 -12.7% 2017 30.8% 2016 5.2% Fund Manager information for Motilal Oswal Midcap 30 Fund
Name Since Tenure Varun Sharma 21 Jan 26 0.44 Yr. Swapnil Mayekar 18 Nov 25 0.62 Yr. Ajay Khandelwal 1 Oct 24 1.75 Yr. Ankit Agarwal 21 Jan 26 0.44 Yr. Rakesh Shetty 22 Nov 22 3.61 Yr. Data below for Motilal Oswal Midcap 30 Fund as on 30 Jun 26
Equity Sector Allocation
Sector Value Financial Services 31.02% Technology 26.84% Industrials 13.76% Consumer Cyclical 13.41% Communication Services 3.08% Real Estate 2.81% Health Care 2.46% Asset Allocation
Asset Class Value Cash 6.63% Equity 93.37% Top Securities Holdings / Portfolio
Name Holding Value Quantity One97 Communications Ltd (Technology)
Equity, Since 30 Sep 24 | PAYTM7% ₹2,659 Cr 23,765,865 Coforge Ltd (Technology)
Equity, Since 31 Mar 23 | COFORGE6% ₹2,233 Cr 15,703,312
↓ -979,603 Kalyan Jewellers India Ltd (Consumer Cyclical)
Equity, Since 29 Feb 24 | KALYANKJIL6% ₹2,180 Cr 61,413,395 KEI Industries Ltd (Industrials)
Equity, Since 30 Nov 24 | KEI6% ₹2,123 Cr 4,030,834 Eternal Ltd (Consumer Cyclical)
Equity, Since 31 Aug 25 | ETERNAL6% ₹2,115 Cr 84,386,866 Persistent Systems Ltd (Technology)
Equity, Since 31 Jan 23 | PERSISTENT6% ₹2,091 Cr 4,026,493 Aditya Birla Capital Ltd (Financial Services)
Equity, Since 30 Jun 25 | ABCAPITAL5% ₹1,906 Cr 52,459,381
↓ -1,000,000 Billionbrains Garage Ventures Ltd (Financial Services)
Equity, Since 31 Jan 26 | GROWW4% ₹1,564 Cr 84,616,660 Multi Commodity Exchange of India Ltd (Financial Services)
Equity, Since 31 Jan 26 | MCX4% ₹1,539 Cr 5,209,458 BSE Ltd (Financial Services)
Equity, Since 30 Nov 25 | BSE4% ₹1,451 Cr 3,500,830
↓ -256,232 6. Nippon India Power and Infra Fund
Nippon India Power and Infra Fund
Growth Launch Date 8 May 04 NAV (29 Jul 26) ₹377.346 ↑ 2.18 (0.58 %) Net Assets (Cr) ₹8,043 on 30 Jun 26 Category Equity - Sectoral AMC Nippon Life Asset Management Ltd. Rating ☆☆☆☆ Risk High Expense Ratio 1.85 Sharpe Ratio 0.24 Information Ratio 0.56 Alpha Ratio 8.81 Min Investment 5,000 Min SIP Investment 100 Exit Load 0-1 Years (1%),1 Years and above(NIL) Growth of 10,000 investment over the years.
Date Value 30 Jun 21 ₹10,000 30 Jun 22 ₹10,223 30 Jun 23 ₹15,004 30 Jun 24 ₹27,370 30 Jun 25 ₹26,049 30 Jun 26 ₹28,381 Returns for Nippon India Power and Infra Fund
absolute basis & more than 1 year are on CAGR (Compound Annual Growth Rate) basis. as on 29 Jul 26 Duration Returns 1 Month -1.6% 3 Month -1% 6 Month 13.1% 1 Year 10.3% 3 Year 20.1% 5 Year 21.6% 10 Year 15 Year Since launch 17.7% Historical performance (Yearly) on absolute basis
Year Returns 2025 -0.5% 2024 26.9% 2023 58% 2022 10.9% 2021 48.9% 2020 10.8% 2019 -2.9% 2018 -21.1% 2017 61.7% 2016 0.1% Fund Manager information for Nippon India Power and Infra Fund
Name Since Tenure Kinjal Desai 25 May 18 8.11 Yr. Rahul Modi 19 Aug 24 1.87 Yr. Amber Singhania 11 Mar 26 0.31 Yr. Data below for Nippon India Power and Infra Fund as on 30 Jun 26
Equity Sector Allocation
Sector Value Industrials 34.92% Utility 22.36% Consumer Cyclical 11.45% Energy 9.18% Basic Materials 6.78% Technology 4.51% Financial Services 4.09% Communication Services 2.39% Real Estate 1.47% Health Care 1.24% Asset Allocation
Asset Class Value Cash 1.59% Equity 98.41% Top Securities Holdings / Portfolio
Name Holding Value Quantity Reliance Industries Ltd (Energy)
Equity, Since 30 Nov 18 | RELIANCE8% ₹616 Cr 4,660,000 Larsen & Toubro Ltd (Industrials)
Equity, Since 30 Nov 07 | LT7% ₹557 Cr 1,366,958
↑ 20,000 NTPC Ltd (Utilities)
Equity, Since 31 May 09 | NTPC6% ₹487 Cr 12,600,000
↓ -554,060 NTPC Green Energy Ltd (Utilities)
Equity, Since 30 Nov 24 | NTPCGREEN4% ₹296 Cr 28,594,584
↑ 2,403,505 Tata Power Co Ltd (Utilities)
Equity, Since 30 Apr 23 | TATAPOWER3% ₹246 Cr 5,850,789
↓ -100,000 Bharat Heavy Electricals Ltd (Industrials)
Equity, Since 30 Sep 24 | BHEL3% ₹242 Cr 5,800,000
↓ -1,148,468 Triveni Turbine Ltd (Industrials)
Equity, Since 30 Jun 25 | TRITURBINE3% ₹237 Cr 3,193,288
↑ 120,000 Power Finance Corp Ltd (Financial Services)
Equity, Since 31 Oct 24 | PFC3% ₹198 Cr 4,620,000
↑ 720,000 Bharti Airtel Ltd (Communication Services)
Equity, Since 30 Apr 18 | BHARTIARTL2% ₹188 Cr 1,030,000
↑ 180,000 CG Power & Industrial Solutions Ltd (Industrials)
Equity, Since 30 Sep 24 | CGPOWER2% ₹174 Cr 1,893,400
↓ -276,614 7. DSP India T.I.G.E.R Fund
DSP India T.I.G.E.R Fund
Growth Launch Date 11 Jun 04 NAV (29 Jul 26) ₹357.156 ↑ 1.67 (0.47 %) Net Assets (Cr) ₹6,264 on 30 Jun 26 Category Equity - Sectoral AMC DSP BlackRock Invmt Managers Pvt. Ltd. Rating ☆☆☆☆ Risk High Expense Ratio 1.89 Sharpe Ratio 0.44 Information Ratio 0 Alpha Ratio 0 Min Investment 1,000 Min SIP Investment 500 Exit Load 0-12 Months (1%),12 Months and above(NIL) Growth of 10,000 investment over the years.
Date Value 30 Jun 21 ₹10,000 30 Jun 22 ₹10,551 30 Jun 23 ₹14,508 30 Jun 24 ₹25,980 30 Jun 25 ₹25,049 30 Jun 26 ₹28,384 Returns for DSP India T.I.G.E.R Fund
absolute basis & more than 1 year are on CAGR (Compound Annual Growth Rate) basis. as on 29 Jul 26 Duration Returns 1 Month -1% 3 Month 3% 6 Month 16.2% 1 Year 14.4% 3 Year 21.5% 5 Year 21.5% 10 Year 15 Year Since launch 17.5% Historical performance (Yearly) on absolute basis
Year Returns 2025 -2.5% 2024 32.4% 2023 49% 2022 13.9% 2021 51.6% 2020 2.7% 2019 6.7% 2018 -17.2% 2017 47% 2016 4.1% Fund Manager information for DSP India T.I.G.E.R Fund
Name Since Tenure Rohit Singhania 21 Jun 10 16.04 Yr. Data below for DSP India T.I.G.E.R Fund as on 30 Jun 26
Equity Sector Allocation
Sector Value Industrials 28.69% Basic Materials 13.29% Energy 9.47% Utility 9.46% Financial Services 8.49% Consumer Cyclical 6.52% Health Care 6.13% Communication Services 2.58% Technology 1.52% Real Estate 1.49% Consumer Defensive 0.71% Asset Allocation
Asset Class Value Cash 11.66% Equity 88.34% Top Securities Holdings / Portfolio
Name Holding Value Quantity Reliance Industries Ltd (Energy)
Equity, Since 31 Aug 19 | RELIANCE4% ₹262 Cr 1,983,815
↑ 1,304,235 NTPC Ltd (Utilities)
Equity, Since 30 Nov 17 | NTPC4% ₹249 Cr 6,433,748
↓ -94,844 Apollo Hospitals Enterprise Ltd (Healthcare)
Equity, Since 31 Dec 24 | APOLLOHOSP4% ₹247 Cr 301,630 Larsen & Toubro Ltd (Industrials)
Equity, Since 30 Jun 04 | LT4% ₹240 Cr 588,665 Kirloskar Oil Engines Ltd (Industrials)
Equity, Since 31 Mar 23 | 5332933% ₹161 Cr 834,973 Bharti Airtel Ltd (Communication Services)
Equity, Since 31 Oct 18 | BHARTIARTL3% ₹155 Cr 849,969 Coal India Ltd (Energy)
Equity, Since 31 Dec 23 | COALINDIA3% ₹154 Cr 3,352,298
↑ 647,118 INOX India Ltd (Industrials)
Equity, Since 31 Dec 23 | INOXINDIA2% ₹139 Cr 931,429
↓ -9,412 UltraTech Cement Ltd (Basic Materials)
Equity, Since 31 Dec 14 | ULTRACEMCO2% ₹135 Cr 118,010
↑ 51,464 Hindustan Aeronautics Ltd Ordinary Shares (Industrials)
Equity, Since 31 Oct 25 | HAL2% ₹131 Cr 305,098 8. Invesco India PSU Equity Fund
Invesco India PSU Equity Fund
Growth Launch Date 18 Nov 09 NAV (29 Jul 26) ₹64.53 ↑ 0.12 (0.19 %) Net Assets (Cr) ₹1,473 on 30 Jun 26 Category Equity - Sectoral AMC Invesco Asset Management (India) Private Ltd Rating ☆☆☆ Risk High Expense Ratio 2.14 Sharpe Ratio -0.16 Information Ratio -0.57 Alpha Ratio -6.88 Min Investment 5,000 Min SIP Investment 500 Exit Load 0-1 Years (1%),1 Years and above(NIL) Growth of 10,000 investment over the years.
Date Value 30 Jun 21 ₹10,000 30 Jun 22 ₹9,722 30 Jun 23 ₹13,891 30 Jun 24 ₹27,099 30 Jun 25 ₹26,286 30 Jun 26 ₹26,262 Returns for Invesco India PSU Equity Fund
absolute basis & more than 1 year are on CAGR (Compound Annual Growth Rate) basis. as on 29 Jul 26 Duration Returns 1 Month -0.4% 3 Month -5.6% 6 Month -6.5% 1 Year 3% 3 Year 20.3% 5 Year 20.6% 10 Year 15 Year Since launch 11.8% Historical performance (Yearly) on absolute basis
Year Returns 2025 10.3% 2024 25.6% 2023 54.5% 2022 20.5% 2021 31.1% 2020 6.1% 2019 10.1% 2018 -16.9% 2017 24.3% 2016 17.9% Fund Manager information for Invesco India PSU Equity Fund
Name Since Tenure Hiten Jain 1 Jul 25 1 Yr. Sagar Gandhi 1 Jul 25 1 Yr. Data below for Invesco India PSU Equity Fund as on 30 Jun 26
Equity Sector Allocation
Sector Value Financial Services 30.26% Industrials 29.89% Utility 19.1% Energy 13.91% Basic Materials 3.59% Consumer Cyclical 1.59% Asset Allocation
Asset Class Value Cash 1.66% Equity 98.34% Top Securities Holdings / Portfolio
Name Holding Value Quantity State Bank of India (Financial Services)
Equity, Since 28 Feb 21 | SBIN9% ₹128 Cr 1,323,094
↑ 151,862 Hindustan Aeronautics Ltd Ordinary Shares (Industrials)
Equity, Since 31 May 22 | HAL8% ₹112 Cr 261,137 Indian Bank (Financial Services)
Equity, Since 30 Jun 21 | INDIANB8% ₹112 Cr 1,341,970
↑ 78,651 Bharat Petroleum Corp Ltd (Energy)
Equity, Since 30 Sep 18 | BPCL6% ₹92 Cr 3,076,024 Bharat Electronics Ltd (Industrials)
Equity, Since 31 Mar 17 | BEL6% ₹85 Cr 2,078,629 Dredging Corp of India Ltd (Industrials)
Equity, Since 31 Jul 25 | DREDGECORP5% ₹75 Cr 646,300 NTPC Green Energy Ltd (Utilities)
Equity, Since 30 Nov 24 | NTPCGREEN5% ₹71 Cr 6,852,914 Bank of Baroda (Financial Services)
Equity, Since 30 Jun 21 | BANKBARODA5% ₹70 Cr 2,611,219 NTPC Ltd (Utilities)
Equity, Since 31 May 19 | NTPC5% ₹70 Cr 1,801,543 REC Ltd (Financial Services)
Equity, Since 31 Aug 23 | RECLTD4% ₹58 Cr 1,703,577 9. BOI AXA Manufacturing and Infrastructure Fund
BOI AXA Manufacturing and Infrastructure Fund
Growth Launch Date 5 Mar 10 NAV (29 Jul 26) ₹66.51 ↑ 0.47 (0.71 %) Net Assets (Cr) ₹837 on 30 Jun 26 Category Equity - Sectoral AMC BOI AXA Investment Mngrs Private Ltd Rating Risk High Expense Ratio 2.4 Sharpe Ratio 0.53 Information Ratio 0 Alpha Ratio 0 Min Investment 5,000 Min SIP Investment 1,000 Exit Load 0-1 Years (1%),1 Years and above(NIL) Growth of 10,000 investment over the years.
Date Value 30 Jun 21 ₹10,000 30 Jun 22 ₹10,067 30 Jun 23 ₹13,588 30 Jun 24 ₹22,409 30 Jun 25 ₹22,619 30 Jun 26 ₹25,882 Returns for BOI AXA Manufacturing and Infrastructure Fund
absolute basis & more than 1 year are on CAGR (Compound Annual Growth Rate) basis. as on 29 Jul 26 Duration Returns 1 Month 2.2% 3 Month 5.7% 6 Month 14.2% 1 Year 17.2% 3 Year 22.8% 5 Year 20.3% 10 Year 15 Year Since launch 12.2% Historical performance (Yearly) on absolute basis
Year Returns 2025 7.8% 2024 25.7% 2023 44.7% 2022 3.3% 2021 52.5% 2020 28.1% 2019 2.5% 2018 -22.8% 2017 56% 2016 1% Fund Manager information for BOI AXA Manufacturing and Infrastructure Fund
Name Since Tenure Nitin Gosar 27 Sep 22 3.76 Yr. Data below for BOI AXA Manufacturing and Infrastructure Fund as on 30 Jun 26
Equity Sector Allocation
Sector Value Industrials 24.81% Basic Materials 13.14% Consumer Cyclical 12.85% Health Care 11.87% Energy 10.92% Utility 6.13% Communication Services 4.02% Technology 3.57% Consumer Defensive 3.15% Real Estate 1.14% Asset Allocation
Asset Class Value Cash 6.24% Equity 93.66% Debt 0.1% Top Securities Holdings / Portfolio
Name Holding Value Quantity Larsen & Toubro Ltd (Industrials)
Equity, Since 31 Mar 10 | LT7% ₹52 Cr 127,443
↓ -23,672 NTPC Ltd (Utilities)
Equity, Since 31 May 21 | NTPC6% ₹48 Cr 1,250,367 Reliance Industries Ltd (Energy)
Equity, Since 31 Oct 20 | RELIANCE6% ₹47 Cr 356,510 Bharti Airtel Ltd (Communication Services)
Equity, Since 31 Dec 22 | BHARTIARTL4% ₹32 Cr 173,416 Dixon Technologies (India) Ltd (Technology)
Equity, Since 30 Apr 26 | DIXON4% ₹28 Cr 24,451
↑ 8,155 Aurobindo Pharma Ltd (Healthcare)
Equity, Since 31 May 25 | AUROPHARMA4% ₹28 Cr 196,331 Cemindia Projects Ltd (Industrials)
Equity, Since 31 Dec 22 | CEMPRO3% ₹26 Cr 243,152
↓ -65,994 Petronet LNG Ltd (Energy)
Equity, Since 31 Jan 26 | PETRONET3% ₹25 Cr 931,486
↑ 138,246 Stylam Industries Ltd (Consumer Cyclical)
Equity, Since 30 Apr 25 | 5269513% ₹24 Cr 83,372 Lloyds Metals & Energy Ltd (Basic Materials)
Equity, Since 30 Nov 24 | 5124553% ₹23 Cr 130,000
↓ -53,702 10. UTI Transportation & Logistics Fund
UTI Transportation & Logistics Fund
Growth Launch Date 11 Apr 04 NAV (29 Jul 26) ₹294.426 ↑ 0.20 (0.07 %) Net Assets (Cr) ₹3,962 on 30 Jun 26 Category Equity - Sectoral AMC UTI Asset Management Company Ltd Rating ☆☆☆ Risk High Expense Ratio 1.93 Sharpe Ratio 0.12 Information Ratio 0 Alpha Ratio 0 Min Investment 5,000 Min SIP Investment 500 Exit Load 0-1 Years (1%),1 Years and above(NIL) Growth of 10,000 investment over the years.
Date Value 30 Jun 21 ₹10,000 30 Jun 22 ₹11,121 30 Jun 23 ₹14,095 30 Jun 24 ₹21,948 30 Jun 25 ₹21,401 30 Jun 26 ₹22,720 Returns for UTI Transportation & Logistics Fund
absolute basis & more than 1 year are on CAGR (Compound Annual Growth Rate) basis. as on 29 Jul 26 Duration Returns 1 Month 5.6% 3 Month 7.8% 6 Month 5% 1 Year 11.2% 3 Year 18.3% 5 Year 20.1% 10 Year 15 Year Since launch 16.4% Historical performance (Yearly) on absolute basis
Year Returns 2025 19.5% 2024 18.7% 2023 40.1% 2022 14.7% 2021 24.3% 2020 11% 2019 -8.7% 2018 -19.5% 2017 39.6% 2016 4.8% Fund Manager information for UTI Transportation & Logistics Fund
Name Since Tenure Sachin Trivedi 22 Sep 16 9.78 Yr. Data below for UTI Transportation & Logistics Fund as on 30 Jun 26
Equity Sector Allocation
Sector Value Consumer Cyclical 79.75% Industrials 14.72% Asset Allocation
Asset Class Value Cash 5.36% Equity 94.46% Debt 0.13% Top Securities Holdings / Portfolio
Name Holding Value Quantity Mahindra & Mahindra Ltd (Consumer Cyclical)
Equity, Since 30 Apr 04 | M&M13% ₹492 Cr 1,614,940
↓ -49,846 Maruti Suzuki India Ltd (Consumer Cyclical)
Equity, Since 30 Apr 04 | MARUTI9% ₹339 Cr 258,455 Eternal Ltd (Consumer Cyclical)
Equity, Since 31 Jul 21 | ETERNAL9% ₹333 Cr 13,273,081
↑ 500,000 Eicher Motors Ltd (Consumer Cyclical)
Equity, Since 30 Nov 08 | EICHERMOT8% ₹301 Cr 419,126
↓ -44,388 Bajaj Auto Ltd (Consumer Cyclical)
Equity, Since 30 Apr 18 | BAJAJ-AUTO7% ₹263 Cr 251,657 Adani Ports & Special Economic Zone Ltd (Industrials)
Equity, Since 31 May 13 | ADANIPORTS7% ₹253 Cr 1,399,964
↑ 30,000 Hero MotoCorp Ltd (Consumer Cyclical)
Equity, Since 31 Mar 12 | HEROMOTOCO4% ₹151 Cr 308,832
↓ -18,907 Hyundai Motor India Ltd (Consumer Cyclical)
Equity, Since 31 Oct 24 | HYUNDAI4% ₹151 Cr 786,342
↑ 75,000 TVS Motor Co Ltd (Consumer Cyclical)
Equity, Since 30 Sep 19 | TVSMOTOR4% ₹147 Cr 438,430
↑ 35,000 InterGlobe Aviation Ltd (Industrials)
Equity, Since 31 May 18 | INDIGO3% ₹110 Cr 250,430
میوچل فنڈ ایس آئی پی میں آن لائن سرمایہ کاری کیسے کی جائے؟
Fincash.com پر لائف ٹائم کے لیے مفت انویسٹمنٹ اکاؤنٹ کھولیں۔
اپنی رجسٹریشن اور KYC کا عمل مکمل کریں۔
دستاویزات اپ لوڈ کریں (PAN، آدھار، وغیرہ)۔اور، آپ سرمایہ کاری کے لیے تیار ہیں!
یہاں فراہم کردہ معلومات کے درست ہونے کو یقینی بنانے کے لیے تمام کوششیں کی گئی ہیں۔ تاہم، ڈیٹا کی درستگی کے حوالے سے کوئی ضمانت نہیں دی جاتی ہے۔ براہ کرم کوئی بھی سرمایہ کاری کرنے سے پہلے اسکیم کی معلومات کے دستاویز کے ساتھ تصدیق کریں۔
You Might Also Like


AMFI Registration No. 112358 | CIN: U74999MH2016PTC282153
Shepard Technologies Pvt. Ltd. (with ARN code 112358) makes no warranties or representations, express or implied, on products offered through the platform. It accepts no liability for any damages or losses, however caused, in connection with the use of, or on the reliance of its product or related services. Terms and conditions of the website are applicable.
©2026 Shepard Technologies Private Limited. All Rights Reserved
Research Highlights for ICICI Prudential Infrastructure Fund