लंबी अवधि के निवेश के लिए सर्वश्रेष्ठ एसआईपी योजनाएं 2022
व्यवस्थित की अवधारणानिवेश योजना (सिप) पिछले कुछ वर्षों से भारतीय निवेशकों के बीच काफी लोकप्रियता हासिल कर रहा है। यह दीर्घकालिक बचत की आदत बनाने का एक शानदार तरीका है। यह भविष्य के लिए एक बड़ा कोष बनाने में मदद करता हैवित्तीय लक्ष्यों. एक एसआईपी में, एक निश्चित राशि को मासिक रूप से एक निश्चित तिथि पर एक फंड में निवेश किया जाता हैइन्वेस्टर. एक बार जब आप शुरू करते हैंनिवेश एक लंबी अवधि के लिए एक एसआईपी में मासिक, आपका पैसा हर दिन बढ़ने लगता है (स्टॉक में निवेश किया जा रहा हैमंडी) सिस्टमैटिक इन्वेस्टमेंट प्लान आपको अपनी खरीद लागत को औसत करने और रिटर्न को अधिकतम करने में मदद करता है। जब कोई निवेशक एक अवधि में नियमित रूप से निवेश करता है, चाहे बाजार की स्थिति कुछ भी हो, उसे बाजार के कम होने पर अधिक इकाइयाँ और बाज़ार के उच्च होने पर कम इकाइयाँ मिलेंगी। यह आपकी म्यूचुअल फंड इकाइयों की खरीद लागत का औसत निकालता है। इसी तरह, आइए लंबी अवधि में SIP के कुछ सबसे महत्वपूर्ण लाभों की जाँच करें।
Talk to our investment specialist
लंबी अवधि के एसआईपी निवेश के लाभ
SIP के कुछ महत्वपूर्ण लाभ हैं:
कंपाउंडिंग की शक्ति
जब आप लंबी अवधि में निवेश करते हैं, तो आपका निवेश शुरू हो जाता हैकंपाउंडिंग. इसका मतलब यह है कि जब आप अपने निवेश से अर्जित रिटर्न पर रिटर्न अर्जित करते हैं, तो आपका पैसा चक्रवृद्धि शुरू हो जाएगा। यह आपको नियमित रूप से छोटे निवेशों के साथ लंबे समय में एक बड़ा कोष बनाने में मदद करता है।
लक्ष्यों को प्राप्त करने में मदद करता है
SIP आपके सभी दीर्घकालिक वित्तीय लक्ष्यों को प्राप्त करने का एक स्मार्ट तरीका है जैसेनिवृत्ति, शादी, घर/कार की खरीद आदि। निवेशक बस शुरू कर सकते हैंम्यूचुअल फंड में निवेश अपने वित्तीय लक्ष्यों के अनुसार और निश्चित समय पर उन्हें प्राप्त करें। अगर कोई कम उम्र में निवेश करना शुरू कर देता है, तो उसके पास एसआईपी बढ़ने के लिए पर्याप्त समय होता है। इस तरह उनके सभी लक्ष्यों को समय पर पूरा करना भी आसान हो जाता है।
सस्ती
एक व्यवस्थित निवेश योजना के सबसे आकर्षक भागों में से एक इसकी सामर्थ्य है। कोई भी व्यक्ति कम से कम 500 रुपये की राशि का निवेश कर सकता है, जिससे बड़ी संख्या में भारतीयों को निवेश शुरू करने का रास्ता मिल जाता है। इसलिए, जो एकमुश्त भुगतान नहीं कर सकता, वह SIP के माध्यम से निवेश कर सकता हैम्यूचुअल फंड्स.
लंबी अवधि के निवेश के लिए एसआईपी सर्वश्रेष्ठ क्यों है?
निवेशक अक्सर आश्चर्य करते हैं कि एकमुश्त मोड की तुलना में लंबी अवधि में एसआईपी कैसे अधिक लाभदायक होते हैं। खैर, ऐतिहासिक आंकड़े ऐसा कहते हैं! आइए नजर डालते हैं शेयर बाजार के सबसे खराब दौर के आंकड़ों पर।
निवेश शुरू करने की सबसे खराब अवधि सितंबर 1994 के आसपास थी (यह वह समय था जब शेयर बाजार चरम पर था)। बाजार के आंकड़ों पर नजर डालें तो जिस निवेशक ने एकमुश्त निवेश किया था, वह 59 महीने (करीब 5 साल!) के लिए नकारात्मक रिटर्न पर बैठा रहा। जुलाई 1999 में भी निवेशक टूट गया। अगले साल हालांकि कुछ रिटर्न उत्पन्न हुए, लेकिन बाद में 2000 के शेयर बाजार में गिरावट के कारण ये रिटर्न अल्पकालिक थे। एक और 4 साल (नकारात्मक रिटर्न के साथ) भुगतने के बाद और निवेशक अंततः अक्टूबर 2003 में सकारात्मक हो गया। यह संभवतः एकमुश्त निवेश करने का सबसे खराब समय था।
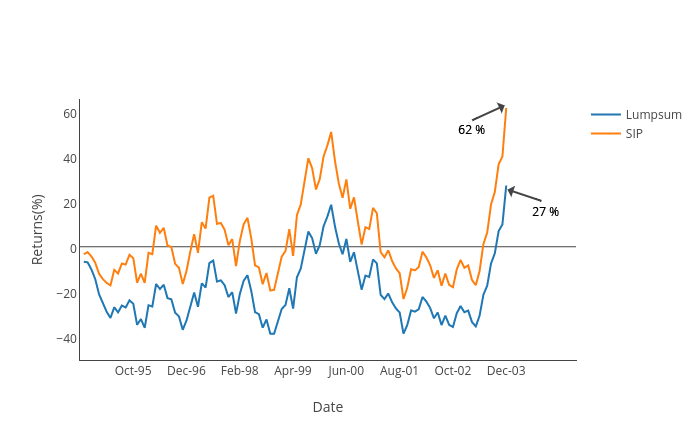
एसआईपी निवेशक का क्या हुआ? व्यवस्थित निवेश योजना निवेशक केवल 19 महीनों के लिए नकारात्मक था और उसने मुनाफा कमाना शुरू कर दिया, हालांकि, ये अल्पकालिक थे। अंतरिम नुकसान झेलने के बाद मई 1999 तक एसआईपी निवेशक फिर से बढ़ गए। जबकि यात्रा अभी भी अस्थिर रही, एसआईपी निवेशकों ने पोर्टफोलियो में बहुत पहले मुनाफा दिखाया।
तो, किसने बेहतर मुनाफा कमाया? एकमुश्त निवेशक के लिए अधिकतम नुकसान लगभग 40% था, जबकि एसआईपी निवेशक के लिए 23% था। व्यवस्थित निवेश योजना निवेशक के पास तेजी से वसूली की अवधि के साथ-साथ पोर्टफोलियो में कम नुकसान भी था।
लंबी अवधि के एसआईपी निवेश के लिए सर्वश्रेष्ठ म्युचुअल फंड
कुछ केसर्वश्रेष्ठ म्युचुअल फंड लंबी अवधि के लिए एसआईपी इस प्रकार हैं-
लॉन्ग टर्म एसआईपी के लिए बेस्ट लार्ज कैप फंड
लार्ज कैप फंड एक प्रकार के हैंइक्विटी म्यूचुअल फंड जहां बड़े बाजार पूंजीकरण वाली कंपनियों के शेयरों में कोष का निवेश किया जाता है। ये कंपनियां मुख्य रूप से बड़े व्यवसायों और बड़ी टीमों वाली बड़ी फर्म हैं। इन कंपनियों का बाजार पूंजीकरण INR 1000 Cr और अधिक है। चूंकि, बड़ी कंपनियों में निवेश किया जाता है, इन फर्मों में साल दर साल स्थिर वृद्धि दिखाने की अधिक संभावना होती है, जो बदले में एक समय के साथ स्थिरता भी प्रदान करती है। इन फंडों को मध्य और की तुलना में बाजार के उतार-चढ़ाव के लिए सुरक्षित और कम अस्थिर माना जाता है।स्मॉल कैप फंड.
Fund NAV Net Assets (Cr) Min SIP Investment 3 MO (%) 6 MO (%) 1 YR (%) 3 YR (%) 5 YR (%) 2024 (%) Invesco India Largecap Fund Growth ₹71.36
↑ 0.11 ₹1,847 100 5.5 3.5 4.5 13.2 12 5.5 Bandhan Large Cap Fund Growth ₹77.51
↓ -0.02 ₹2,061 100 2.5 -0.4 1.6 12 11.5 8.2 ICICI Prudential Bluechip Fund Growth ₹108.11
↓ -0.05 ₹79,421 100 1.1 -3.2 -0.9 11.8 13 11.3 Nippon India Large Cap Fund Growth ₹89.1181
↓ -0.19 ₹53,227 100 0.1 -2 -0.3 11.6 14.8 9.2 DSP TOP 100 Equity Growth ₹456.958
↑ 1.02 ₹7,190 500 1.1 -3.6 -3.1 11.2 10.1 8.4 Note: Returns up to 1 year are on absolute basis & more than 1 year are on CAGR basis. as on 28 Jul 26 Research Highlights & Commentary of 5 Funds showcased
Commentary Invesco India Largecap Fund Bandhan Large Cap Fund ICICI Prudential Bluechip Fund Nippon India Large Cap Fund DSP TOP 100 Equity Point 1 Bottom quartile AUM (₹1,847 Cr). Bottom quartile AUM (₹2,061 Cr). Highest AUM (₹79,421 Cr). Upper mid AUM (₹53,227 Cr). Lower mid AUM (₹7,190 Cr). Point 2 Established history (16+ yrs). Established history (20+ yrs). Established history (18+ yrs). Established history (18+ yrs). Oldest track record among peers (23 yrs). Point 3 Rating: 3★ (lower mid). Rating: 2★ (bottom quartile). Top rated. Rating: 4★ (upper mid). Rating: 2★ (bottom quartile). Point 4 Risk profile: Moderately High. Risk profile: Moderately High. Risk profile: Moderately High. Risk profile: Moderately High. Risk profile: Moderately High. Point 5 5Y return: 11.99% (lower mid). 5Y return: 11.45% (bottom quartile). 5Y return: 13.01% (upper mid). 5Y return: 14.76% (top quartile). 5Y return: 10.15% (bottom quartile). Point 6 3Y return: 13.24% (top quartile). 3Y return: 12.02% (upper mid). 3Y return: 11.79% (lower mid). 3Y return: 11.56% (bottom quartile). 3Y return: 11.17% (bottom quartile). Point 7 1Y return: 4.54% (top quartile). 1Y return: 1.61% (upper mid). 1Y return: -0.88% (bottom quartile). 1Y return: -0.26% (lower mid). 1Y return: -3.11% (bottom quartile). Point 8 Alpha: 3.75 (top quartile). Alpha: 2.34 (upper mid). Alpha: -1.21 (bottom quartile). Alpha: 1.07 (lower mid). Alpha: -2.70 (bottom quartile). Point 9 Sharpe: -0.25 (top quartile). Sharpe: -0.35 (upper mid). Sharpe: -0.55 (bottom quartile). Sharpe: -0.43 (lower mid). Sharpe: -0.68 (bottom quartile). Point 10 Information ratio: 0.82 (lower mid). Information ratio: 0.63 (bottom quartile). Information ratio: 0.85 (upper mid). Information ratio: 0.98 (top quartile). Information ratio: 0.53 (bottom quartile). Invesco India Largecap Fund
Bandhan Large Cap Fund
ICICI Prudential Bluechip Fund
Nippon India Large Cap Fund
DSP TOP 100 Equity
लॉन्ग टर्म एसआईपी के लिए बेस्ट मिड एंड स्मॉल कैप फंड
मिड कैप और स्मॉल कैप फंड एक प्रकार के इक्विटी म्यूचुअल फंड हैं जो भारत में उभरती कंपनियों में निवेश करते हैं।मिड कैप फंड उन कंपनियों में निवेश करें जिनका बाजार पूंजीकरण 500 से 1000 करोड़ रुपये है। और, स्मॉल कैप को आमतौर पर लगभग 500 करोड़ रुपये के मार्केट कैप वाली फर्मों के रूप में परिभाषित किया जाता है। इन फर्मों को बाजार का भावी नेता कहा जाता है। अगर कंपनी भविष्य में अच्छा करती है, तो इन फंडों में लंबे समय में अच्छा रिटर्न देने की काफी संभावनाएं हैं। लेकिन, मिड और स्मॉल कैप फंड में जोखिम अधिक होता है। इसलिए, जब कोई निवेशक इन फंडों में निवेश कर रहा हो, तो उन्हें लंबी अवधि के लिए निवेश करना चाहिए।
Fund NAV Net Assets (Cr) Min SIP Investment 3 MO (%) 6 MO (%) 1 YR (%) 3 YR (%) 5 YR (%) 2024 (%) Motilal Oswal Midcap 30 Fund Growth ₹99.4368
↑ 0.90 ₹37,474 500 8.6 7.5 -1.6 19 22 -12.1 Invesco India Mid Cap Fund Growth ₹197.63
↓ -0.08 ₹13,767 500 9.5 14.7 10.3 24.4 19.6 6.3 Nippon India Small Cap Fund Growth ₹177.786
↓ -1.41 ₹78,407 100 4.1 12.8 5.4 15.8 18.4 -4.7 Edelweiss Mid Cap Fund Growth ₹108.04
↑ 0.22 ₹17,748 500 4 6.3 8.9 21.7 18.2 3.8 Sundaram Mid Cap Fund Growth ₹1,495.67
↑ 3.40 ₹14,026 100 4.6 8.2 9.7 20.4 18 4.1 Note: Returns up to 1 year are on absolute basis & more than 1 year are on CAGR basis. as on 28 Jul 26 Research Highlights & Commentary of 5 Funds showcased
Commentary Motilal Oswal Midcap 30 Fund Invesco India Mid Cap Fund Nippon India Small Cap Fund Edelweiss Mid Cap Fund Sundaram Mid Cap Fund Point 1 Upper mid AUM (₹37,474 Cr). Bottom quartile AUM (₹13,767 Cr). Highest AUM (₹78,407 Cr). Lower mid AUM (₹17,748 Cr). Bottom quartile AUM (₹14,026 Cr). Point 2 Established history (12+ yrs). Established history (19+ yrs). Established history (15+ yrs). Established history (18+ yrs). Oldest track record among peers (24 yrs). Point 3 Rating: 3★ (lower mid). Rating: 2★ (bottom quartile). Top rated. Rating: 3★ (bottom quartile). Rating: 4★ (upper mid). Point 4 Risk profile: Moderately High. Risk profile: Moderately High. Risk profile: Moderately High. Risk profile: High. Risk profile: Moderately High. Point 5 5Y return: 21.96% (top quartile). 5Y return: 19.56% (upper mid). 5Y return: 18.45% (lower mid). 5Y return: 18.23% (bottom quartile). 5Y return: 18.02% (bottom quartile). Point 6 3Y return: 18.99% (bottom quartile). 3Y return: 24.43% (top quartile). 3Y return: 15.81% (bottom quartile). 3Y return: 21.69% (upper mid). 3Y return: 20.43% (lower mid). Point 7 1Y return: -1.58% (bottom quartile). 1Y return: 10.34% (top quartile). 1Y return: 5.40% (bottom quartile). 1Y return: 8.91% (lower mid). 1Y return: 9.74% (upper mid). Point 8 Alpha: -14.72 (bottom quartile). Alpha: 0.00 (lower mid). Alpha: 3.21 (top quartile). Alpha: -1.09 (bottom quartile). Alpha: 0.71 (upper mid). Point 9 Sharpe: -0.71 (bottom quartile). Sharpe: 0.19 (top quartile). Sharpe: 0.02 (lower mid). Sharpe: -0.04 (bottom quartile). Sharpe: 0.06 (upper mid). Point 10 Information ratio: -0.25 (bottom quartile). Information ratio: 0.00 (lower mid). Information ratio: -0.27 (bottom quartile). Information ratio: 0.48 (top quartile). Information ratio: 0.32 (upper mid). Motilal Oswal Midcap 30 Fund
Invesco India Mid Cap Fund
Nippon India Small Cap Fund
Edelweiss Mid Cap Fund
Sundaram Mid Cap Fund
लॉन्ग टर्म SIP के लिए बेस्ट डायवर्सिफाइड फंड्स
विविध निधि इक्विटी म्यूचुअल फंड का एक वर्ग है। ये वे फंड हैं जो बाजार पूंजीकरण में निवेश करते हैं, यानी लार्ज, मिड और स्मॉल कैप फंड में। चूंकि, डायवर्सिफाइड फंड पूरे मार्केट कैप में निवेश करते हैं, वे पोर्टफोलियो को संतुलित करने में माहिर होते हैं। डायवर्सिफाइड फंड्स में निवेश करके निवेशक अपने पोर्टफोलियो में अच्छा बैलेंस बना सकते हैं। हालांकि, अस्थिर बाजार की स्थिति के दौरान वे अभी भी इक्विटी की अस्थिरता से प्रभावित होंगे।
Fund NAV Net Assets (Cr) Min SIP Investment 3 MO (%) 6 MO (%) 1 YR (%) 3 YR (%) 5 YR (%) 2024 (%) IDBI Diversified Equity Fund Growth ₹37.99
↑ 0.14 ₹382 500 10.2 13.2 13.5 22.7 12 Aditya Birla Sun Life Manufacturing Equity Fund Growth ₹37.7
↓ -0.25 ₹1,229 1,000 6.5 17.9 19.6 19.3 14.2 3.5 Motilal Oswal Multicap 35 Fund Growth ₹60.3295
↑ 0.31 ₹13,294 500 7 4.6 -1.4 18.1 12.1 -5.6 BNP Paribas Multi Cap Fund Growth ₹73.5154
↓ -0.01 ₹588 300 -4.6 -2.6 19.3 17.3 13.6 Mahindra Badhat Yojana Growth ₹38.0188
↓ -0.10 ₹6,926 500 5.4 8.1 7.5 16.5 15.4 3.4 Note: Returns up to 1 year are on absolute basis & more than 1 year are on CAGR basis. as on 28 Jul 23 Research Highlights & Commentary of 5 Funds showcased
Commentary IDBI Diversified Equity Fund Aditya Birla Sun Life Manufacturing Equity Fund Motilal Oswal Multicap 35 Fund BNP Paribas Multi Cap Fund Mahindra Badhat Yojana Point 1 Bottom quartile AUM (₹382 Cr). Lower mid AUM (₹1,229 Cr). Highest AUM (₹13,294 Cr). Bottom quartile AUM (₹588 Cr). Upper mid AUM (₹6,926 Cr). Point 2 Established history (12+ yrs). Established history (11+ yrs). Established history (12+ yrs). Oldest track record among peers (20 yrs). Established history (9+ yrs). Point 3 Rating: 2★ (lower mid). Not Rated. Top rated. Rating: 4★ (upper mid). Not Rated. Point 4 Risk profile: Moderately High. Risk profile: High. Risk profile: Moderately High. Risk profile: Moderately High. Risk profile: Moderately High. Point 5 5Y return: 12.03% (bottom quartile). 5Y return: 14.20% (upper mid). 5Y return: 12.14% (bottom quartile). 5Y return: 13.57% (lower mid). 5Y return: 15.38% (top quartile). Point 6 3Y return: 22.73% (top quartile). 3Y return: 19.25% (upper mid). 3Y return: 18.06% (lower mid). 3Y return: 17.28% (bottom quartile). 3Y return: 16.54% (bottom quartile). Point 7 1Y return: 13.54% (lower mid). 1Y return: 19.61% (top quartile). 1Y return: -1.36% (bottom quartile). 1Y return: 19.34% (upper mid). 1Y return: 7.53% (bottom quartile). Point 8 Alpha: -1.07 (bottom quartile). Alpha: 0.00 (upper mid). Alpha: -7.36 (bottom quartile). Alpha: 0.00 (lower mid). Alpha: 4.46 (top quartile). Point 9 Sharpe: 1.01 (upper mid). Sharpe: 0.54 (lower mid). Sharpe: -0.74 (bottom quartile). Sharpe: 2.86 (top quartile). Sharpe: 0.01 (bottom quartile). Point 10 Information ratio: -0.53 (bottom quartile). Information ratio: 0.00 (lower mid). Information ratio: 0.53 (upper mid). Information ratio: 0.00 (bottom quartile). Information ratio: 0.64 (top quartile). IDBI Diversified Equity Fund
Aditya Birla Sun Life Manufacturing Equity Fund
Motilal Oswal Multicap 35 Fund
BNP Paribas Multi Cap Fund
Mahindra Badhat Yojana
SIP लॉन्ग टर्म के लिए बेस्ट सेक्टर फंड्स
क्षेत्र निधि के विशिष्ट क्षेत्रों की प्रतिभूतियों में निवेश करता हैअर्थव्यवस्था, जैसे दूरसंचार, बैंकिंग, एफएमसीजी, सूचना प्रौद्योगिकी (आईटी), फार्मास्युटिकल, और बुनियादी ढांचा, आदि। उदाहरण के लिए, एक फार्मा फंड केवल फार्मा कंपनियों के शेयरों में निवेश कर सकता है और एक बैंकिंग क्षेत्र का फंड बैंकों में निवेश कर सकता है। सेक्टर-विशिष्ट फंड होने के कारण ऐसे फंडों में जोखिम अधिक होता है। इस प्रकार, एक निवेशक को फंड में निवेश करने से पहले विशिष्ट क्षेत्र के बारे में गहराई से जानकारी होनी चाहिए।
Fund NAV Net Assets (Cr) Min SIP Investment 3 MO (%) 6 MO (%) 1 YR (%) 3 YR (%) 5 YR (%) 2024 (%) DSP Natural Resources and New Energy Fund Growth ₹105.693
↑ 0.13 ₹2,401 500 -5.6 2.5 17.7 19 15.5 17.5 Aditya Birla Sun Life Banking And Financial Services Fund Growth ₹62.75
↓ -0.07 ₹3,676 1,000 2.1 -1 4 10.4 11.4 17.5 Franklin Build India Fund Growth ₹142.055
↓ -1.06 ₹3,256 500 -4.7 1.4 1.3 17.9 19.3 3.7 Bandhan Infrastructure Fund Growth ₹49.232
↓ -0.40 ₹1,545 100 0.3 8 -1.1 16.5 16.6 -6.9 Sundaram Rural and Consumption Fund Growth ₹93.736
↑ 0.48 ₹1,422 100 5 3.4 -2.8 10.2 11.5 -0.1 Note: Returns up to 1 year are on absolute basis & more than 1 year are on CAGR basis. as on 27 Jul 26 Research Highlights & Commentary of 5 Funds showcased
Commentary DSP Natural Resources and New Energy Fund Aditya Birla Sun Life Banking And Financial Services Fund Franklin Build India Fund Bandhan Infrastructure Fund Sundaram Rural and Consumption Fund Point 1 Lower mid AUM (₹2,401 Cr). Highest AUM (₹3,676 Cr). Upper mid AUM (₹3,256 Cr). Bottom quartile AUM (₹1,545 Cr). Bottom quartile AUM (₹1,422 Cr). Point 2 Established history (18+ yrs). Established history (12+ yrs). Established history (16+ yrs). Established history (15+ yrs). Oldest track record among peers (20 yrs). Point 3 Top rated. Rating: 5★ (upper mid). Rating: 5★ (lower mid). Rating: 5★ (bottom quartile). Rating: 5★ (bottom quartile). Point 4 Risk profile: High. Risk profile: High. Risk profile: High. Risk profile: High. Risk profile: Moderately High. Point 5 5Y return: 15.53% (lower mid). 5Y return: 11.42% (bottom quartile). 5Y return: 19.32% (top quartile). 5Y return: 16.59% (upper mid). 5Y return: 11.53% (bottom quartile). Point 6 3Y return: 19.00% (top quartile). 3Y return: 10.36% (bottom quartile). 3Y return: 17.93% (upper mid). 3Y return: 16.53% (lower mid). 3Y return: 10.16% (bottom quartile). Point 7 1Y return: 17.72% (top quartile). 1Y return: 3.98% (upper mid). 1Y return: 1.31% (lower mid). 1Y return: -1.12% (bottom quartile). 1Y return: -2.79% (bottom quartile). Point 8 Alpha: 0.00 (upper mid). Alpha: 3.47 (top quartile). Alpha: 0.00 (lower mid). Alpha: 0.00 (bottom quartile). Alpha: -6.29 (bottom quartile). Point 9 Sharpe: 0.72 (top quartile). Sharpe: -0.06 (lower mid). Sharpe: -0.04 (upper mid). Sharpe: -0.25 (bottom quartile). Sharpe: -0.67 (bottom quartile). Point 10 Information ratio: 0.00 (upper mid). Information ratio: 0.24 (top quartile). Information ratio: 0.00 (lower mid). Information ratio: 0.00 (bottom quartile). Information ratio: -0.56 (bottom quartile). DSP Natural Resources and New Energy Fund
Aditya Birla Sun Life Banking And Financial Services Fund
Franklin Build India Fund
Bandhan Infrastructure Fund
Sundaram Rural and Consumption Fund
यहां प्रदान की गई जानकारी सटीक है, यह सुनिश्चित करने के लिए सभी प्रयास किए गए हैं। हालांकि, डेटा की शुद्धता के संबंध में कोई गारंटी नहीं दी जाती है। कृपया कोई भी निवेश करने से पहले योजना सूचना दस्तावेज के साथ सत्यापित करें।
You Might Also Like


AMFI Registration No. 112358 | CIN: U74999MH2016PTC282153
Shepard Technologies Pvt. Ltd. (with ARN code 112358) makes no warranties or representations, express or implied, on products offered through the platform. It accepts no liability for any damages or losses, however caused, in connection with the use of, or on the reliance of its product or related services. Terms and conditions of the website are applicable.
©2026 Shepard Technologies Private Limited. All Rights Reserved
Very good for young generation.