سرمایہ کاری کے لیے ٹاپ 5 بہترین ایکویٹی ایس آئی پی فنڈز
اگر آپ چاہتے ہیں کہ آپ کی سرمایہ کاری سب میں پسند کی جائے۔مارکیٹ حالات، پھر اپنی سرمایہ کاری کریں۔گھونٹ راستہ! سیسٹیمیٹک انویسٹمنٹ پلانز (SIPs) کو سب سے زیادہ موثر طریقے سمجھا جاتا ہے۔میوچل فنڈز میں سرمایہ کاری. اور اگر آپ ایکویٹیز میں سرمایہ کاری کرنے کا منصوبہ بنا رہے ہیں، تو SIPs خواہش مند منافع کمانے کا بہترین طریقہ ہیں۔ بہترین ایکویٹی ایس آئی پی فنڈز آپ کو طویل مدتی میں مطلوبہ منافع دے سکتے ہیں۔مالی اہداف. تو، آئیے دیکھتے ہیں کہ SIP کیسے کام کرتا ہے، اس کے فوائدSIP سرمایہ کاریکا اہم استعمال aگھونٹ کیلکولیٹر ایکویٹی سرمایہ کاری کے لیے بہترین کارکردگی کا مظاہرہ کرنے والے SIP فنڈز کے ساتھ۔
Talk to our investment specialist
ایکویٹی میوچل فنڈز کے لیے منظم سرمایہ کاری
مثالی طور پر، جب سرمایہ کار ایکوئٹی میں سرمایہ کاری کرنے کا ارادہ رکھتے ہیں، تو وہ اکثر منافع کے استحکام پر شک کرتے ہیں۔ اس کی وجہ یہ ہے کہ وہ مارکیٹ سے جڑے ہوئے ہیں اور اکثر اتار چڑھاؤ کا شکار رہتے ہیں۔ اس طرح، اس طرح کے اتار چڑھاؤ کو متوازن کرنے اور طویل مدتی مستحکم منافع کو یقینی بنانے کے لیے، ایکویٹی سرمایہ کاری میں SIPs انتہائی قابل سفارش ہیں۔ تاریخی طور پر، مارکیٹ کے خراب مرحلے میں، یہ دیکھا گیا ہے کہ SIP کا راستہ اختیار کرنے والے سرمایہ کاروں نے یکمشت راستہ اختیار کرنے والوں کے مقابلے میں زیادہ مستحکم منافع حاصل کیا۔ SIP کی سرمایہ کاری وقت کے ساتھ ساتھ پھیل جاتی ہے، ایک یکمشت سرمایہ کاری کے برعکس جو ایک ہی وقت میں ہوتی ہے۔ لہذا، SIP میں آپ کی رقم ہر روز بڑھنے لگتی ہے (اسٹاک مارکیٹ میں سرمایہ کاری کی جا رہی ہے)۔
ایک منظمسرمایہ کاری کا منصوبہ جیسے طویل مدتی مالی اہداف کو حاصل کرنے کے لیے بھی وسیع پیمانے پر سمجھا جاتا ہے۔ریٹائرمنٹ پلاننگ، بچے کی تعلیم، گھر/گاڑی کی خریداری یا کوئی اور اثاثہ۔ اس سے پہلے کہ ہم کچھ اور دیکھیںسرمایہ کاری کے فوائد ایس آئی پی میں، آئیے سرمایہ کاری کے لیے کچھ بہترین ایکویٹی ایس آئی پی فنڈز کو دیکھیں۔
ایکویٹی فنڈز 2022 کے لیے بہترین SIP پلان
بہترین لارج کیپ ایکویٹی ایس آئی پی فنڈز
Fund NAV Net Assets (Cr) Min SIP Investment 3 MO (%) 6 MO (%) 1 YR (%) 3 YR (%) 5 YR (%) 2025 (%) JM Core 11 Fund Growth ₹20.2837
↑ 0.17 ₹286 500 6.5 6.1 4.7 12.9 14.1 -1.9 SBI Bluechip Fund Growth ₹94.1437
↑ 0.18 ₹55,064 500 3.2 -0.2 2.1 9.5 10.8 9.7 Indiabulls Blue Chip Fund Growth ₹43.37
↑ 0.34 ₹132 500 3.7 0.8 1.8 10.4 10.2 7.5 Nippon India Large Cap Fund Growth ₹90.5135
↑ 0.23 ₹53,227 100 2.1 -0.8 0.4 11.9 14.9 9.2 Aditya Birla Sun Life Frontline Equity Fund Growth ₹524.9
↑ 1.77 ₹29,029 100 3.9 -1.1 0 10.4 10.9 9.4 Note: Returns up to 1 year are on absolute basis & more than 1 year are on CAGR basis. as on 31 Jul 26 Research Highlights & Commentary of 5 Funds showcased
Commentary JM Core 11 Fund SBI Bluechip Fund Indiabulls Blue Chip Fund Nippon India Large Cap Fund Aditya Birla Sun Life Frontline Equity Fund Point 1 Bottom quartile AUM (₹286 Cr). Highest AUM (₹55,064 Cr). Bottom quartile AUM (₹132 Cr). Upper mid AUM (₹53,227 Cr). Lower mid AUM (₹29,029 Cr). Point 2 Established history (18+ yrs). Established history (20+ yrs). Established history (14+ yrs). Established history (19+ yrs). Oldest track record among peers (23 yrs). Point 3 Top rated. Rating: 4★ (upper mid). Rating: 4★ (lower mid). Rating: 4★ (bottom quartile). Rating: 4★ (bottom quartile). Point 4 Risk profile: High. Risk profile: Moderately High. Risk profile: Moderately High. Risk profile: Moderately High. Risk profile: Moderately High. Point 5 5Y return: 14.15% (upper mid). 5Y return: 10.84% (bottom quartile). 5Y return: 10.24% (bottom quartile). 5Y return: 14.95% (top quartile). 5Y return: 10.91% (lower mid). Point 6 3Y return: 12.88% (top quartile). 3Y return: 9.55% (bottom quartile). 3Y return: 10.44% (lower mid). 3Y return: 11.92% (upper mid). 3Y return: 10.37% (bottom quartile). Point 7 1Y return: 4.68% (top quartile). 1Y return: 2.09% (upper mid). 1Y return: 1.81% (lower mid). 1Y return: 0.41% (bottom quartile). 1Y return: 0.00% (bottom quartile). Point 8 Alpha: 2.17 (upper mid). Alpha: 3.45 (top quartile). Alpha: 1.28 (lower mid). Alpha: 1.07 (bottom quartile). Alpha: -2.27 (bottom quartile). Point 9 Sharpe: -0.23 (top quartile). Sharpe: -0.28 (upper mid). Sharpe: -0.39 (lower mid). Sharpe: -0.43 (bottom quartile). Sharpe: -0.61 (bottom quartile). Point 10 Information ratio: 0.15 (upper mid). Information ratio: -0.05 (bottom quartile). Information ratio: 0.06 (lower mid). Information ratio: 0.98 (top quartile). Information ratio: -0.10 (bottom quartile). JM Core 11 Fund
SBI Bluechip Fund
Indiabulls Blue Chip Fund
Nippon India Large Cap Fund
Aditya Birla Sun Life Frontline Equity Fund
بہترین لارج اور مڈ کیپ ایکویٹی ایس آئی پی فنڈز
Fund NAV Net Assets (Cr) Min SIP Investment 3 MO (%) 6 MO (%) 1 YR (%) 3 YR (%) 5 YR (%) 2025 (%) Invesco India Growth Opportunities Fund Growth ₹109.74
↑ 0.18 ₹11,164 100 11.6 15.6 8.8 22.8 17.2 4.7 Kotak Equity Opportunities Fund Growth ₹354.938
↑ 1.80 ₹31,263 1,000 4 1.6 4.4 13.9 14 5.6 DSP Equity Opportunities Fund Growth ₹624.745
↑ 0.37 ₹17,906 500 3.4 -1.1 2.2 14.6 12.4 7.1 Aditya Birla Sun Life Equity Advantage Fund Growth ₹946.82
↑ 3.57 ₹5,784 1,000 5.5 5.6 6.1 11.7 8.8 3.5 Bandhan Core Equity Fund Growth ₹140.111
↑ 0.12 ₹18,783 100 2 3.5 5.6 18.1 16.6 7.5 Note: Returns up to 1 year are on absolute basis & more than 1 year are on CAGR basis. as on 31 Jul 26 Research Highlights & Commentary of 5 Funds showcased
Commentary Invesco India Growth Opportunities Fund Kotak Equity Opportunities Fund DSP Equity Opportunities Fund Aditya Birla Sun Life Equity Advantage Fund Bandhan Core Equity Fund Point 1 Bottom quartile AUM (₹11,164 Cr). Highest AUM (₹31,263 Cr). Lower mid AUM (₹17,906 Cr). Bottom quartile AUM (₹5,784 Cr). Upper mid AUM (₹18,783 Cr). Point 2 Established history (18+ yrs). Established history (21+ yrs). Established history (26+ yrs). Oldest track record among peers (31 yrs). Established history (20+ yrs). Point 3 Top rated. Rating: 5★ (upper mid). Rating: 5★ (lower mid). Rating: 4★ (bottom quartile). Rating: 4★ (bottom quartile). Point 4 Risk profile: Moderately High. Risk profile: Moderately High. Risk profile: Moderately High. Risk profile: Moderately High. Risk profile: Moderately High. Point 5 5Y return: 17.20% (top quartile). 5Y return: 14.03% (lower mid). 5Y return: 12.42% (bottom quartile). 5Y return: 8.76% (bottom quartile). 5Y return: 16.57% (upper mid). Point 6 3Y return: 22.84% (top quartile). 3Y return: 13.95% (bottom quartile). 3Y return: 14.61% (lower mid). 3Y return: 11.73% (bottom quartile). 3Y return: 18.14% (upper mid). Point 7 1Y return: 8.75% (top quartile). 1Y return: 4.42% (bottom quartile). 1Y return: 2.24% (bottom quartile). 1Y return: 6.15% (upper mid). 1Y return: 5.62% (lower mid). Point 8 Alpha: 6.78 (top quartile). Alpha: 0.20 (lower mid). Alpha: -2.56 (bottom quartile). Alpha: 0.16 (bottom quartile). Alpha: 2.69 (upper mid). Point 9 Sharpe: 0.12 (top quartile). Sharpe: -0.19 (lower mid). Sharpe: -0.35 (bottom quartile). Sharpe: -0.19 (bottom quartile). Sharpe: -0.05 (upper mid). Point 10 Information ratio: 1.15 (upper mid). Information ratio: -0.05 (bottom quartile). Information ratio: 0.20 (lower mid). Information ratio: -0.96 (bottom quartile). Information ratio: 1.42 (top quartile). Invesco India Growth Opportunities Fund
Kotak Equity Opportunities Fund
DSP Equity Opportunities Fund
Aditya Birla Sun Life Equity Advantage Fund
Bandhan Core Equity Fund
بہترین مڈ کیپ ایکویٹی ایس آئی پی فنڈز
Fund NAV Net Assets (Cr) Min SIP Investment 3 MO (%) 6 MO (%) 1 YR (%) 3 YR (%) 5 YR (%) 2025 (%) Sundaram Mid Cap Fund Growth ₹1,509.38
↑ 3.96 ₹14,026 100 6.6 8.4 10 20.3 17.9 4.1 Kotak Emerging Equity Scheme Growth ₹145.925
↑ 0.49 ₹67,611 1,000 6.1 10.6 7.2 18.6 16.6 1.8 Taurus Discovery (Midcap) Fund Growth ₹126.43
↑ 0.59 ₹125 1,000 9.8 9.3 4.4 11 12.1 0.8 BNP Paribas Mid Cap Fund Growth ₹111.57
↑ 0.71 ₹2,513 300 4.7 8.2 11.1 17.7 14.8 2.5 Edelweiss Mid Cap Fund Growth ₹108.69
↑ 0.44 ₹17,748 500 5.6 6.5 9.2 21.6 18 3.8 Note: Returns up to 1 year are on absolute basis & more than 1 year are on CAGR basis. as on 31 Jul 26 Research Highlights & Commentary of 5 Funds showcased
Commentary Sundaram Mid Cap Fund Kotak Emerging Equity Scheme Taurus Discovery (Midcap) Fund BNP Paribas Mid Cap Fund Edelweiss Mid Cap Fund Point 1 Lower mid AUM (₹14,026 Cr). Highest AUM (₹67,611 Cr). Bottom quartile AUM (₹125 Cr). Bottom quartile AUM (₹2,513 Cr). Upper mid AUM (₹17,748 Cr). Point 2 Established history (24+ yrs). Established history (19+ yrs). Oldest track record among peers (31 yrs). Established history (20+ yrs). Established history (18+ yrs). Point 3 Top rated. Rating: 4★ (upper mid). Rating: 4★ (lower mid). Rating: 3★ (bottom quartile). Rating: 3★ (bottom quartile). Point 4 Risk profile: Moderately High. Risk profile: Moderately High. Risk profile: Moderately High. Risk profile: High. Risk profile: High. Point 5 5Y return: 17.87% (upper mid). 5Y return: 16.61% (lower mid). 5Y return: 12.12% (bottom quartile). 5Y return: 14.79% (bottom quartile). 5Y return: 17.97% (top quartile). Point 6 3Y return: 20.33% (upper mid). 3Y return: 18.63% (lower mid). 3Y return: 11.04% (bottom quartile). 3Y return: 17.66% (bottom quartile). 3Y return: 21.55% (top quartile). Point 7 1Y return: 9.97% (upper mid). 1Y return: 7.19% (bottom quartile). 1Y return: 4.38% (bottom quartile). 1Y return: 11.06% (top quartile). 1Y return: 9.21% (lower mid). Point 8 Alpha: 0.71 (upper mid). Alpha: 0.70 (lower mid). Alpha: -9.74 (bottom quartile). Alpha: 3.32 (top quartile). Alpha: -1.09 (bottom quartile). Point 9 Sharpe: 0.06 (upper mid). Sharpe: 0.06 (lower mid). Sharpe: -0.32 (bottom quartile). Sharpe: 0.22 (top quartile). Sharpe: -0.04 (bottom quartile). Point 10 Information ratio: 0.32 (upper mid). Information ratio: -0.07 (lower mid). Information ratio: -2.03 (bottom quartile). Information ratio: -0.21 (bottom quartile). Information ratio: 0.48 (top quartile). Sundaram Mid Cap Fund
Kotak Emerging Equity Scheme
Taurus Discovery (Midcap) Fund
BNP Paribas Mid Cap Fund
Edelweiss Mid Cap Fund
بہترین سمال کیپ ایکویٹی ایس آئی پی فنڈز
Fund NAV Net Assets (Cr) Min SIP Investment 3 MO (%) 6 MO (%) 1 YR (%) 3 YR (%) 5 YR (%) 2025 (%) Aditya Birla Sun Life Small Cap Fund Growth ₹96.6213
↑ 0.64 ₹5,731 1,000 8.8 17.5 12.8 15.1 12.4 -3.7 SBI Small Cap Fund Growth ₹177.456
↓ -0.02 ₹40,157 500 5.7 11.3 2.9 10.9 13.1 -4.9 DSP Small Cap Fund Growth ₹220.438
↑ 0.67 ₹19,635 500 8.9 18.6 10.4 16.3 16.5 -2.8 Nippon India Small Cap Fund Growth ₹179.922
↑ 1.16 ₹78,407 100 5.6 13 6.2 15.9 18.4 -4.7 Franklin India Smaller Companies Fund Growth ₹176.638
↑ 0.36 ₹14,336 500 3.6 11.5 2.2 14 16.1 -8.4 Note: Returns up to 1 year are on absolute basis & more than 1 year are on CAGR basis. as on 31 Jul 26 Research Highlights & Commentary of 5 Funds showcased
Commentary Aditya Birla Sun Life Small Cap Fund SBI Small Cap Fund DSP Small Cap Fund Nippon India Small Cap Fund Franklin India Smaller Companies Fund Point 1 Bottom quartile AUM (₹5,731 Cr). Upper mid AUM (₹40,157 Cr). Lower mid AUM (₹19,635 Cr). Highest AUM (₹78,407 Cr). Bottom quartile AUM (₹14,336 Cr). Point 2 Established history (19+ yrs). Established history (16+ yrs). Established history (19+ yrs). Established history (15+ yrs). Oldest track record among peers (20 yrs). Point 3 Top rated. Rating: 5★ (upper mid). Rating: 4★ (lower mid). Rating: 4★ (bottom quartile). Rating: 4★ (bottom quartile). Point 4 Risk profile: Moderately High. Risk profile: Moderately High. Risk profile: Moderately High. Risk profile: Moderately High. Risk profile: Moderately High. Point 5 5Y return: 12.43% (bottom quartile). 5Y return: 13.14% (bottom quartile). 5Y return: 16.54% (upper mid). 5Y return: 18.43% (top quartile). 5Y return: 16.06% (lower mid). Point 6 3Y return: 15.12% (lower mid). 3Y return: 10.92% (bottom quartile). 3Y return: 16.27% (top quartile). 3Y return: 15.86% (upper mid). 3Y return: 13.99% (bottom quartile). Point 7 1Y return: 12.80% (top quartile). 1Y return: 2.86% (bottom quartile). 1Y return: 10.38% (upper mid). 1Y return: 6.20% (lower mid). 1Y return: 2.17% (bottom quartile). Point 8 Alpha: 0.00 (upper mid). Alpha: 0.00 (lower mid). Alpha: 0.00 (bottom quartile). Alpha: 3.21 (top quartile). Alpha: -0.56 (bottom quartile). Point 9 Sharpe: 0.22 (top quartile). Sharpe: -0.07 (bottom quartile). Sharpe: 0.19 (upper mid). Sharpe: 0.02 (lower mid). Sharpe: -0.15 (bottom quartile). Point 10 Information ratio: 0.00 (top quartile). Information ratio: 0.00 (upper mid). Information ratio: 0.00 (lower mid). Information ratio: -0.27 (bottom quartile). Information ratio: -0.65 (bottom quartile). Aditya Birla Sun Life Small Cap Fund
SBI Small Cap Fund
DSP Small Cap Fund
Nippon India Small Cap Fund
Franklin India Smaller Companies Fund
بہترین ملٹی کیپ ایکویٹی ایس آئی پی فنڈز
Fund NAV Net Assets (Cr) Min SIP Investment 3 MO (%) 6 MO (%) 1 YR (%) 3 YR (%) 5 YR (%) 2025 (%) Kotak Standard Multicap Fund Growth ₹85.846
↑ 0.38 ₹55,850 500 3 -1 1.6 12.3 11.6 9.5 Mirae Asset India Equity Fund Growth ₹113.181
↑ 0.23 ₹38,379 1,000 4.3 -0.3 0.9 9.1 9.4 10.2 Motilal Oswal Multicap 35 Fund Growth ₹61.5094
↑ 0.31 ₹13,294 500 10.5 7 -0.3 18.7 12.4 -5.6 BNP Paribas Multi Cap Fund Growth ₹73.5154
↓ -0.01 ₹588 300 -4.6 -2.6 19.3 17.3 13.6 Aditya Birla Sun Life Equity Fund Growth ₹1,952
↑ 5.59 ₹26,727 100 7 6.3 10.2 15.3 12.6 11.2 Note: Returns up to 1 year are on absolute basis & more than 1 year are on CAGR basis. as on 31 Jul 26 Research Highlights & Commentary of 5 Funds showcased
Commentary Kotak Standard Multicap Fund Mirae Asset India Equity Fund Motilal Oswal Multicap 35 Fund BNP Paribas Multi Cap Fund Aditya Birla Sun Life Equity Fund Point 1 Highest AUM (₹55,850 Cr). Upper mid AUM (₹38,379 Cr). Bottom quartile AUM (₹13,294 Cr). Bottom quartile AUM (₹588 Cr). Lower mid AUM (₹26,727 Cr). Point 2 Established history (16+ yrs). Established history (18+ yrs). Established history (12+ yrs). Established history (20+ yrs). Oldest track record among peers (27 yrs). Point 3 Top rated. Rating: 5★ (upper mid). Rating: 5★ (lower mid). Rating: 4★ (bottom quartile). Rating: 4★ (bottom quartile). Point 4 Risk profile: Moderately High. Risk profile: Moderately High. Risk profile: Moderately High. Risk profile: Moderately High. Risk profile: Moderately High. Point 5 5Y return: 11.57% (bottom quartile). 5Y return: 9.37% (bottom quartile). 5Y return: 12.41% (lower mid). 5Y return: 13.57% (top quartile). 5Y return: 12.59% (upper mid). Point 6 3Y return: 12.31% (bottom quartile). 3Y return: 9.06% (bottom quartile). 3Y return: 18.75% (top quartile). 3Y return: 17.28% (upper mid). 3Y return: 15.29% (lower mid). Point 7 1Y return: 1.57% (lower mid). 1Y return: 0.85% (bottom quartile). 1Y return: -0.33% (bottom quartile). 1Y return: 19.34% (top quartile). 1Y return: 10.17% (upper mid). Point 8 Alpha: -1.04 (bottom quartile). Alpha: 0.72 (upper mid). Alpha: -7.36 (bottom quartile). Alpha: 0.00 (lower mid). Alpha: 4.61 (top quartile). Point 9 Sharpe: -0.38 (lower mid). Sharpe: -0.42 (bottom quartile). Sharpe: -0.74 (bottom quartile). Sharpe: 2.86 (top quartile). Sharpe: -0.05 (upper mid). Point 10 Information ratio: 0.11 (lower mid). Information ratio: -0.47 (bottom quartile). Information ratio: 0.53 (upper mid). Information ratio: 0.00 (bottom quartile). Information ratio: 1.19 (top quartile). Kotak Standard Multicap Fund
Mirae Asset India Equity Fund
Motilal Oswal Multicap 35 Fund
BNP Paribas Multi Cap Fund
Aditya Birla Sun Life Equity Fund
بہترین سیکٹر ایکویٹی ایس آئی پی فنڈز
Fund NAV Net Assets (Cr) Min SIP Investment 3 MO (%) 6 MO (%) 1 YR (%) 3 YR (%) 5 YR (%) 2025 (%) DSP Natural Resources and New Energy Fund Growth ₹106.327
↑ 0.33 ₹2,401 500 -4.7 0.4 18.3 19.2 15 17.5 Aditya Birla Sun Life Banking And Financial Services Fund Growth ₹63.22
↑ 0.50 ₹3,676 1,000 3.6 -0.6 5 10.3 11.5 17.5 Franklin Build India Fund Growth ₹144.394
↑ 0.99 ₹3,256 500 -2 1.9 1.9 18.1 19.7 3.7 Bandhan Infrastructure Fund Growth ₹49.429
↑ 0.28 ₹1,545 100 1.5 7.9 -1.5 16.2 16.4 -6.9 Sundaram Rural and Consumption Fund Growth ₹95.1263
↑ 0.10 ₹1,422 100 6 4.8 -2.2 10.6 11.7 -0.1 Note: Returns up to 1 year are on absolute basis & more than 1 year are on CAGR basis. as on 30 Jul 26 Research Highlights & Commentary of 5 Funds showcased
Commentary DSP Natural Resources and New Energy Fund Aditya Birla Sun Life Banking And Financial Services Fund Franklin Build India Fund Bandhan Infrastructure Fund Sundaram Rural and Consumption Fund Point 1 Lower mid AUM (₹2,401 Cr). Highest AUM (₹3,676 Cr). Upper mid AUM (₹3,256 Cr). Bottom quartile AUM (₹1,545 Cr). Bottom quartile AUM (₹1,422 Cr). Point 2 Established history (18+ yrs). Established history (12+ yrs). Established history (16+ yrs). Established history (15+ yrs). Oldest track record among peers (20 yrs). Point 3 Top rated. Rating: 5★ (upper mid). Rating: 5★ (lower mid). Rating: 5★ (bottom quartile). Rating: 5★ (bottom quartile). Point 4 Risk profile: High. Risk profile: High. Risk profile: High. Risk profile: High. Risk profile: Moderately High. Point 5 5Y return: 14.99% (lower mid). 5Y return: 11.51% (bottom quartile). 5Y return: 19.68% (top quartile). 5Y return: 16.44% (upper mid). 5Y return: 11.75% (bottom quartile). Point 6 3Y return: 19.21% (top quartile). 3Y return: 10.29% (bottom quartile). 3Y return: 18.05% (upper mid). 3Y return: 16.23% (lower mid). 3Y return: 10.63% (bottom quartile). Point 7 1Y return: 18.33% (top quartile). 1Y return: 4.98% (upper mid). 1Y return: 1.90% (lower mid). 1Y return: -1.52% (bottom quartile). 1Y return: -2.17% (bottom quartile). Point 8 Alpha: 0.00 (upper mid). Alpha: 3.47 (top quartile). Alpha: 0.00 (lower mid). Alpha: 0.00 (bottom quartile). Alpha: -6.29 (bottom quartile). Point 9 Sharpe: 0.72 (top quartile). Sharpe: -0.06 (lower mid). Sharpe: -0.04 (upper mid). Sharpe: -0.25 (bottom quartile). Sharpe: -0.67 (bottom quartile). Point 10 Information ratio: 0.00 (upper mid). Information ratio: 0.24 (top quartile). Information ratio: 0.00 (lower mid). Information ratio: 0.00 (bottom quartile). Information ratio: -0.56 (bottom quartile). DSP Natural Resources and New Energy Fund
Aditya Birla Sun Life Banking And Financial Services Fund
Franklin Build India Fund
Bandhan Infrastructure Fund
Sundaram Rural and Consumption Fund
بہترین ELSS SIP فنڈز
Fund NAV Net Assets (Cr) Min SIP Investment 3 MO (%) 6 MO (%) 1 YR (%) 3 YR (%) 5 YR (%) 2025 (%) Tata India Tax Savings Fund Growth ₹46.8846
↑ 0.31 ₹4,597 500 4.4 5.1 6.6 12.4 13 4.9 Bandhan Tax Advantage (ELSS) Fund Growth ₹155.975
↑ 0.18 ₹6,911 500 3.6 1.5 3.8 9.9 12 8 Aditya Birla Sun Life Tax Relief '96 Growth ₹62.25
↑ 0.18 ₹14,467 500 4 1.8 3.1 11.9 8.9 9.3 DSP Tax Saver Fund Growth ₹139.786
↑ 0.25 ₹16,562 500 3.1 -1.7 0.9 14.1 12.7 7.5 HDFC Long Term Advantage Fund Growth ₹595.168
↑ 0.28 ₹1,318 500 1.2 15.4 35.5 20.6 17.4 Note: Returns up to 1 year are on absolute basis & more than 1 year are on CAGR basis. as on 31 Jul 26 Research Highlights & Commentary of 5 Funds showcased
Commentary Tata India Tax Savings Fund Bandhan Tax Advantage (ELSS) Fund Aditya Birla Sun Life Tax Relief '96 DSP Tax Saver Fund HDFC Long Term Advantage Fund Point 1 Bottom quartile AUM (₹4,597 Cr). Lower mid AUM (₹6,911 Cr). Upper mid AUM (₹14,467 Cr). Highest AUM (₹16,562 Cr). Bottom quartile AUM (₹1,318 Cr). Point 2 Established history (11+ yrs). Established history (17+ yrs). Established history (18+ yrs). Established history (19+ yrs). Oldest track record among peers (25 yrs). Point 3 Top rated. Rating: 5★ (upper mid). Rating: 4★ (lower mid). Rating: 4★ (bottom quartile). Rating: 3★ (bottom quartile). Point 4 Risk profile: Moderately High. Risk profile: Moderately High. Risk profile: Moderately High. Risk profile: Moderately High. Risk profile: Moderately High. Point 5 5Y return: 13.00% (upper mid). 5Y return: 12.04% (bottom quartile). 5Y return: 8.94% (bottom quartile). 5Y return: 12.66% (lower mid). 5Y return: 17.39% (top quartile). Point 6 3Y return: 12.37% (lower mid). 3Y return: 9.90% (bottom quartile). 3Y return: 11.86% (bottom quartile). 3Y return: 14.14% (upper mid). 3Y return: 20.64% (top quartile). Point 7 1Y return: 6.56% (upper mid). 1Y return: 3.77% (lower mid). 1Y return: 3.13% (bottom quartile). 1Y return: 0.87% (bottom quartile). 1Y return: 35.51% (top quartile). Point 8 Alpha: 4.23 (top quartile). Alpha: 0.89 (lower mid). Alpha: 0.31 (bottom quartile). Alpha: -1.27 (bottom quartile). Alpha: 1.75 (upper mid). Point 9 Sharpe: -0.09 (upper mid). Sharpe: -0.29 (lower mid). Sharpe: -0.30 (bottom quartile). Sharpe: -0.39 (bottom quartile). Sharpe: 2.27 (top quartile). Point 10 Information ratio: 0.22 (upper mid). Information ratio: -0.51 (bottom quartile). Information ratio: -0.24 (bottom quartile). Information ratio: 0.70 (top quartile). Information ratio: -0.15 (lower mid). Tata India Tax Savings Fund
Bandhan Tax Advantage (ELSS) Fund
Aditya Birla Sun Life Tax Relief '96
DSP Tax Saver Fund
HDFC Long Term Advantage Fund
بہترین ویلیو ایکویٹی ایس آئی پی فنڈز
Fund NAV Net Assets (Cr) Min SIP Investment 3 MO (%) 6 MO (%) 1 YR (%) 3 YR (%) 5 YR (%) 2025 (%) Tata Equity PE Fund Growth ₹350.267
↑ 1.39 ₹8,342 150 1.8 -1.1 1.8 12.7 14.3 3.7 JM Value Fund Growth ₹94.6417
↑ 0.51 ₹823 500 3.2 3 -3 12.2 14.7 -4.4 Aditya Birla Sun Life Pure Value Fund Growth ₹135.586
↓ -0.14 ₹6,603 1,000 5.3 7.4 10.8 15.4 14.2 2.6 HDFC Capital Builder Value Fund Growth ₹788.576
↑ 2.63 ₹7,583 300 6.1 4.5 6.8 15.8 14.6 8.6 Bandhan Sterling Value Fund Growth ₹147.847
↓ -0.01 ₹9,985 100 2.3 0.1 1.6 10.5 12.9 5 Note: Returns up to 1 year are on absolute basis & more than 1 year are on CAGR basis. as on 31 Jul 26 Research Highlights & Commentary of 5 Funds showcased
Commentary Tata Equity PE Fund JM Value Fund Aditya Birla Sun Life Pure Value Fund HDFC Capital Builder Value Fund Bandhan Sterling Value Fund Point 1 Upper mid AUM (₹8,342 Cr). Bottom quartile AUM (₹823 Cr). Bottom quartile AUM (₹6,603 Cr). Lower mid AUM (₹7,583 Cr). Highest AUM (₹9,985 Cr). Point 2 Established history (22+ yrs). Established history (29+ yrs). Established history (18+ yrs). Oldest track record among peers (32 yrs). Established history (18+ yrs). Point 3 Top rated. Rating: 4★ (upper mid). Rating: 3★ (lower mid). Rating: 3★ (bottom quartile). Rating: 3★ (bottom quartile). Point 4 Risk profile: Moderately High. Risk profile: High. Risk profile: Moderately High. Risk profile: Moderately High. Risk profile: Moderately High. Point 5 5Y return: 14.28% (lower mid). 5Y return: 14.66% (top quartile). 5Y return: 14.16% (bottom quartile). 5Y return: 14.64% (upper mid). 5Y return: 12.88% (bottom quartile). Point 6 3Y return: 12.74% (lower mid). 3Y return: 12.24% (bottom quartile). 3Y return: 15.40% (upper mid). 3Y return: 15.84% (top quartile). 3Y return: 10.46% (bottom quartile). Point 7 1Y return: 1.79% (lower mid). 1Y return: -3.00% (bottom quartile). 1Y return: 10.76% (top quartile). 1Y return: 6.80% (upper mid). 1Y return: 1.56% (bottom quartile). Point 8 Alpha: -2.09 (bottom quartile). Alpha: -1.90 (bottom quartile). Alpha: 6.28 (top quartile). Alpha: 3.42 (upper mid). Alpha: -0.78 (lower mid). Point 9 Sharpe: -0.45 (bottom quartile). Sharpe: -0.42 (bottom quartile). Sharpe: 0.01 (top quartile). Sharpe: -0.13 (upper mid). Sharpe: -0.39 (lower mid). Point 10 Information ratio: 0.23 (bottom quartile). Information ratio: 0.30 (lower mid). Information ratio: 0.70 (upper mid). Information ratio: 1.47 (top quartile). Information ratio: -0.16 (bottom quartile). Tata Equity PE Fund
JM Value Fund
Aditya Birla Sun Life Pure Value Fund
HDFC Capital Builder Value Fund
Bandhan Sterling Value Fund
بہترین فوکسڈ ایکویٹی ایس آئی پی فنڈز
Fund NAV Net Assets (Cr) Min SIP Investment 3 MO (%) 6 MO (%) 1 YR (%) 3 YR (%) 5 YR (%) 2025 (%) Axis Focused 25 Fund Growth ₹55.82
↑ 0.73 ₹11,078 500 8.9 6.5 1.6 9.4 5.8 2.5 Aditya Birla Sun Life Focused Equity Fund Growth ₹148.816
↑ 0.46 ₹7,855 1,000 5.6 1.4 6.8 13.4 12.2 10.1 Sundaram Select Focus Fund Growth ₹264.968
↓ -1.18 ₹1,354 100 -5 8.5 24.5 17 17.3 Motilal Oswal Focused 25 Fund Growth ₹50.3259
↑ 0.64 ₹1,635 500 12.4 18.6 16.6 11.6 9.9 -1.7 HDFC Focused 30 Fund Growth ₹234.77
↑ 0.13 ₹27,303 300 5.5 0.3 3.1 15.9 18.4 10.9 Note: Returns up to 1 year are on absolute basis & more than 1 year are on CAGR basis. as on 31 Jul 26 Research Highlights & Commentary of 5 Funds showcased
Commentary Axis Focused 25 Fund Aditya Birla Sun Life Focused Equity Fund Sundaram Select Focus Fund Motilal Oswal Focused 25 Fund HDFC Focused 30 Fund Point 1 Upper mid AUM (₹11,078 Cr). Lower mid AUM (₹7,855 Cr). Bottom quartile AUM (₹1,354 Cr). Bottom quartile AUM (₹1,635 Cr). Highest AUM (₹27,303 Cr). Point 2 Established history (14+ yrs). Established history (20+ yrs). Oldest track record among peers (24 yrs). Established history (13+ yrs). Established history (21+ yrs). Point 3 Top rated. Rating: 4★ (upper mid). Rating: 3★ (lower mid). Rating: 3★ (bottom quartile). Rating: 3★ (bottom quartile). Point 4 Risk profile: Moderately High. Risk profile: Moderately High. Risk profile: Moderately High. Risk profile: Moderately High. Risk profile: Moderately High. Point 5 5Y return: 5.82% (bottom quartile). 5Y return: 12.23% (lower mid). 5Y return: 17.29% (upper mid). 5Y return: 9.85% (bottom quartile). 5Y return: 18.36% (top quartile). Point 6 3Y return: 9.44% (bottom quartile). 3Y return: 13.43% (lower mid). 3Y return: 17.03% (top quartile). 3Y return: 11.56% (bottom quartile). 3Y return: 15.86% (upper mid). Point 7 1Y return: 1.58% (bottom quartile). 1Y return: 6.80% (lower mid). 1Y return: 24.49% (top quartile). 1Y return: 16.56% (upper mid). 1Y return: 3.05% (bottom quartile). Point 8 Alpha: -3.54 (bottom quartile). Alpha: -0.11 (upper mid). Alpha: -5.62 (bottom quartile). Alpha: 12.39 (top quartile). Alpha: -0.27 (lower mid). Point 9 Sharpe: -0.52 (bottom quartile). Sharpe: -0.32 (bottom quartile). Sharpe: 1.85 (top quartile). Sharpe: 0.35 (upper mid). Sharpe: -0.32 (lower mid). Point 10 Information ratio: -0.78 (bottom quartile). Information ratio: 0.12 (upper mid). Information ratio: -0.52 (bottom quartile). Information ratio: -0.21 (lower mid). Information ratio: 0.67 (top quartile). Axis Focused 25 Fund
Aditya Birla Sun Life Focused Equity Fund
Sundaram Select Focus Fund
Motilal Oswal Focused 25 Fund
HDFC Focused 30 Fund
ایکویٹی فنڈز پر ٹیکس
بجٹ 2018 کی تقریر کے مطابق، ایک نئی لانگ ٹرمسرمایہ ایکویٹی پر مبنی گینز (LTCG) ٹیکسباہمی چندہ اور اسٹاک یکم اپریل سے لاگو ہوں گے۔ مالیاتی بل 2018 14 مارچ 2018 کو لوک سبھا میں صوتی ووٹ سے منظور ہوا۔انکم ٹیکس تبدیلیاں یکم اپریل 2018 سے ایکویٹی سرمایہ کاری کو متاثر کریں گی۔*
1. طویل مدتی کیپٹل گینز
LTCGs جو INR 1 لاکھ سے زیادہ ہیں۔رہائی یکم اپریل 2018 کو یا اس کے بعد میوچل فنڈ یونٹس یا ایکویٹیز پر 10 فیصد (پلس سیس) یا 10.4 فیصد ٹیکس لگے گا۔ طویل مدتیکیپٹل گینز 1 لاکھ روپے تک مستثنیٰ ہوگا۔ مثال کے طور پر، اگر آپ ایک مالی سال میں اسٹاکس یا میوچل فنڈ کی سرمایہ کاری سے مشترکہ طویل مدتی سرمائے میں INR 3 لاکھ کماتے ہیں۔ قابل ٹیکس LTCGs INR 2 لاکھ (INR 3 لاکھ - 1 لاکھ) اورٹیکس کی ذمہ داری 20 روپے ہوں گے،000 (INR 2 لاکھ کا 10 فیصد)۔
طویل مدتی سرمایہ نفع وہ منافع ہے جو فروخت کرنے یا چھڑانے سے حاصل ہوتا ہے۔ایکویٹی فنڈز ایک سال سے زیادہ منعقد.
2. شارٹ ٹرم کیپیٹل گینز
اگر میوچل فنڈ یونٹس ہولڈنگ کے ایک سال سے پہلے فروخت کیے جاتے ہیں، تو شارٹ ٹرم کیپیٹل گینز (STCGs) ٹیکس لاگو ہوگا۔ STCGs ٹیکس کو 15 فیصد پر برقرار رکھا گیا ہے۔
| ایکویٹی اسکیمیں | انعقاد کا دورانیہ | ٹیکس کی شرح |
|---|---|---|
| طویل مدتی کیپیٹل گینز (LTCG) | 1 سال سے زیادہ | 10% (بغیر اشاریہ کے) **** |
| شارٹ ٹرم کیپیٹل گینز (STCG) | ایک سال سے کم یا اس کے برابر | 15% |
| تقسیم شدہ ڈیویڈنڈ پر ٹیکس | - | 10%# |
*1 لاکھ روپے تک کے منافع ٹیکس سے پاک ہیں۔ INR 1 لاکھ سے زیادہ کے منافع پر 10% ٹیکس لاگو ہوتا ہے۔ قبل ازیں شرح 0% لاگت کا حساب 31 جنوری 2018 کو اختتامی قیمت کے طور پر کیا گیا تھا۔ #10% کا ڈیویڈنڈ ٹیکس + سرچارج 12% + 4% = 11.648% صحت اور تعلیم 4% کا سیس متعارف کرایا گیا۔ پہلے تعلیمی سیس 3 تھا۔%
SIP سرمایہ کاری کے فوائد
کچھ اہممنظم سرمایہ کاری کے منصوبوں کے فوائد ہیں:
روپے کی لاگت کا اوسط
SIP کی پیشکش کا سب سے بڑا فائدہ روپی لاگت کا اوسط ہے، جو کسی فرد کو اثاثہ کی خریداری کی لاگت کا اوسط نکالنے میں مدد کرتا ہے۔ میوچل فنڈ میں یکمشت سرمایہ کاری کرتے وقت ایک مخصوص تعداد میں یونٹ خریدے جاتے ہیں۔سرمایہ کار سب ایک ساتھ، ایس آئی پی کی صورت میں یونٹس کی خریداری ایک طویل مدت میں کی جاتی ہے اور یہ ماہانہ وقفوں (عام طور پر) پر یکساں طور پر پھیل جاتی ہیں۔ سرمایہ کاری کو وقت کے ساتھ ساتھ پھیلانے کی وجہ سے، سرمایہ کاری مختلف قیمت پوائنٹس پر اسٹاک مارکیٹ میں کی جاتی ہے جس سے سرمایہ کار کو اوسط لاگت کا فائدہ ہوتا ہے، اس لیے اصطلاح روپیہ لاگت کا اوسط ہے۔
کمپاؤنڈنگ کی طاقت
SIPs کا فائدہ پیش کرتے ہیں۔کمپاؤنڈنگ کی طاقت. سادہ سود تب ہوتا ہے جب آپ صرف اصل پر سود حاصل کرتے ہیں۔ مرکب سود کی صورت میں، سود کی رقم پرنسپل میں شامل کی جاتی ہے، اور سود کا حساب نئے پرنسپل (پرانے پرنسپل کے علاوہ منافع) پر کیا جاتا ہے۔ یہ عمل ہر بار جاری رہتا ہے۔ چونکہ ایس آئی پی میں میوچل فنڈز قسطوں میں ہوتے ہیں، اس لیے وہ مرکب ہوتے ہیں، جو ابتدائی طور پر لگائی گئی رقم میں مزید اضافہ کرتے ہیں۔
استطاعت
SIPs بہت سستی ہیں۔ ایس آئی پی میں ماہانہ کم از کم سرمایہ کاری کی رقم 500 روپے تک کم ہو سکتی ہے۔ کچھ فنڈ ہاؤسز، یہاں تک کہ "مائیکرو ایس آئی پی" کہلانے والی چیز بھی پیش کرتے ہیں جہاں ٹکٹ کا سائز 100 روپے تک کم ہوتا ہے۔ یہ نوجوانوں کے لیے ایک اچھا آپشن فراہم کرتا ہے کہ وہ اپنا طویل سفر شروع کر سکیں۔ زندگی کے ابتدائی مرحلے میں مدتی سرمایہ کاری۔
ایس آئی پی کیلکولیٹر
SIP کیلکولیٹر آپ کی سرمایہ کاری میں سب سے مفید ٹول ہو سکتا ہے۔ یہ اس وقت تک آپ کی SIP سرمایہ کاری میں اضافے کا تخمینہ لگاتا ہے جب تک کہ آپ سرمایہ کاری میں رہنا چاہیں گے۔ تو، اس سے پہلے بھیسرمایہ کاری ایک فنڈ میں، کوئی اپنے کل SIP کا پہلے سے تعین کر سکتا ہے۔کمائی ایس آئی پی کیلکولیٹر کے ذریعے۔ کیلکولیٹر عام طور پر ان پٹ لیتے ہیں جیسے SIP سرمایہ کاری کی رقم جو کوئی سرمایہ کاری کرنا چاہتا ہے، سرمایہ کاری کی مدت، متوقعمہنگائی شرحیں (کسی کو اس کا حساب دینا ہوگا)۔ اس کی مثال ذیل میں دی گئی ہے:
فرض کریں، اگر آپ 10 سال کے لیے INR 5,000 کی سرمایہ کاری کرتے ہیں، تو دیکھیں کہ آپ کی SIP سرمایہ کاری کیسے بڑھتی ہے۔
ماہانہ سرمایہ کاری: INR 5,000
سرمایہ کاری کی مدت: 10 سال
سرمایہ کاری کی کل رقم: INR 6,00,000
طویل مدتی ترقی کی شرح (تقریباً): 14%
SIP کیلکولیٹر کے مطابق متوقع واپسی۔: 12,46,462 روپے
خالص منافع: INR 6,46,462
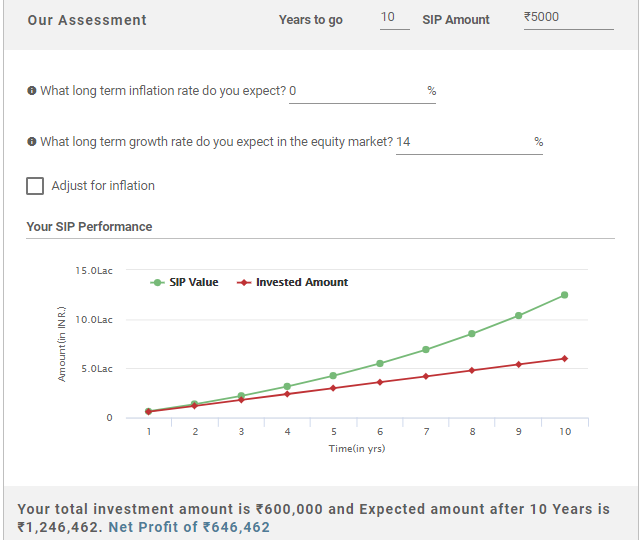
مندرجہ بالا حسابات سے پتہ چلتا ہے کہ اگر آپ 10 سال کے لیے ماہانہ INR 5,000 (مجموعی طور پر 6,00,000 INR) کی سرمایہ کاری کرتے ہیں تو آپ کمائیں گے۔12,46,462 روپے جس کا مطلب ہے کہ آپ جو خالص منافع کماتے ہیں۔INR 6,46,462 کیا یہ بہت اچھا نہیں ہے!
یہاں فراہم کردہ معلومات کے درست ہونے کو یقینی بنانے کے لیے تمام کوششیں کی گئی ہیں۔ تاہم، ڈیٹا کی درستگی کے حوالے سے کوئی ضمانت نہیں دی جاتی ہے۔ براہ کرم کوئی بھی سرمایہ کاری کرنے سے پہلے اسکیم کی معلومات کے دستاویز کے ساتھ تصدیق کریں۔


AMFI Registration No. 112358 | CIN: U74999MH2016PTC282153
Shepard Technologies Pvt. Ltd. (with ARN code 112358) makes no warranties or representations, express or implied, on products offered through the platform. It accepts no liability for any damages or losses, however caused, in connection with the use of, or on the reliance of its product or related services. Terms and conditions of the website are applicable.
©2026 Shepard Technologies Private Limited. All Rights Reserved