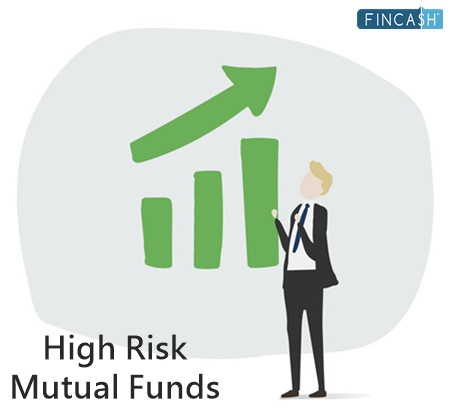
ہندوستان میں ٹاپ 5 بہترین ہائی رسک میوچل فنڈز
زیادہ خطرہباہمی چندہ ایسے فنڈز کا حوالہ دیں جن میں مستقبل میں زیادہ منافع دینے کی صلاحیت ہو۔
یہ وہ فنڈز ہیں جو مثالی طور پر ان سرمایہ کاروں کے لیے ہیں جو سرمایہ کاری میں اعلیٰ سطح کا خطرہ مول لینے کے لیے تیار ہیں۔ لیکن، یہ فنڈز فطرت میں انتہائی غیر مستحکم ہیں۔ یہی وجہ ہے کہ پورٹ فولیو میں اتنے زیادہ رسک فنڈ کو وقتاً فوقتاً فعال طور پر منظم کرنے کی ضرورت ہے۔ ہائی رسک میوچل فنڈز عام طور پر سرمایہ کاروں کو زبردست منافع فراہم کرتے ہیں۔ لہذا، اگر آپ اچھا منافع کمانے کے لیے زیادہ رسک لینے کے لیے تیار ہیں، تو آپ ترجیح دے سکتے ہیں۔سرمایہ کاری ان درج فنڈز میں۔
ہائی رسک انویسٹمنٹس کیا ہیں؟
ہائی رسک فنڈز طویل مدتی دولت کی تخلیق میں مدد کرتے ہیں۔ کوئی ان کی طویل مدتی منصوبہ بندی بھی کر سکتا ہے۔مالی اہداف جیسا کہریٹائرمنٹدنیا کی سیر، خوابوں کے گھر کی خریداری، شادی وغیرہ، ان فنڈز میں سرمایہ کاری کر کے۔ ہائی رسک فنڈز طویل مدتی سرمایہ کاری ہیں جن کا مقصد طویل مدت کے لیے سرمایہ کاری کرنا ہے جو کہ 5 سال سے زیادہ ہے۔
میوچل فنڈز جو اس طرح کی سرمایہ کاری کے لیے تجویز کیے جاتے ہیں۔ایکویٹی فنڈز. ایکویٹی فنڈ کو زیادہ رسک والا، ہائی ریٹرن فنڈ سمجھا جاتا ہے۔ ایکویٹی فنڈز کمپنیوں کے اسٹاکس/حصص میں سرمایہ کاری کرتے ہیں۔ کسی فرم میں براہ راست شروع کیے یا سرمایہ کاری کیے بغیر (چھوٹے حصے میں) کاروبار کا مالک بننے کا یہ ایک بہترین طریقہ ہے۔ ایکویٹی فنڈز کی مختلف اقسام ہیں جیسےبڑے کیپ فنڈزوسط اورسمال کیپ فنڈز,متنوع فنڈز,سیکٹر فنڈز اورای ایل ایس ایس (ایکویٹی سے منسلک بچت اسکیمیں)۔
بہترین ہائی رسک میوچل فنڈز
مڈ اینڈ سمال کیپ فنڈز
مڈ اور سمال کیپ فنڈز بالترتیب درمیانی اور چھوٹی (یا اسٹارٹ اپ) کمپنیوں میں سرمایہ کاری کرتے ہیں۔ چونکہ یہ فنڈز ابھرتی ہوئی کمپنیوں کے ذخیرے پر مشتمل ہوتے ہیں، اس لیے یہ بہت خطرناک نوعیت کے ہوتے ہیں۔ لہذا، وہ سرمایہ کار جو تقریباً 7-10 سال اور اس سے زیادہ کے لیے سرمایہ کاری کر سکتے ہیں، انہیں صرف ان فنڈز میں سرمایہ کاری کو ترجیح دینی چاہیے۔ اگر کمپنیاں طویل مدت میں اچھی کارکردگی کا مظاہرہ کرتی ہیں، تو سرمایہ کار اچھا منافع کما سکتے ہیں۔
Fund NAV Net Assets (Cr) 3 MO (%) 6 MO (%) 1 YR (%) 3 YR (%) 5 YR (%) 2025 (%) Invesco India Mid Cap Fund Growth ₹197.72
↑ 0.24 ₹13,767 10.5 14.9 10.2 24.1 19.2 6.3 ICICI Prudential MidCap Fund Growth ₹338.35
↑ 3.08 ₹7,846 2.7 10.1 14 21.8 17.1 11.1 Edelweiss Mid Cap Fund Growth ₹108.69
↑ 0.44 ₹17,748 5.6 6.5 9.2 21.6 18 3.8 Sundaram Mid Cap Fund Growth ₹1,509.38
↑ 3.96 ₹14,026 6.6 8.4 10 20.3 17.9 4.1 Motilal Oswal Midcap 30 Fund Growth ₹100.253
↑ 0.39 ₹37,474 10.2 8.9 -1.6 19.2 21.7 -12.1 Note: Returns up to 1 year are on absolute basis & more than 1 year are on CAGR basis. as on 31 Jul 26 Research Highlights & Commentary of 5 Funds showcased
Commentary Invesco India Mid Cap Fund ICICI Prudential MidCap Fund Edelweiss Mid Cap Fund Sundaram Mid Cap Fund Motilal Oswal Midcap 30 Fund Point 1 Bottom quartile AUM (₹13,767 Cr). Bottom quartile AUM (₹7,846 Cr). Upper mid AUM (₹17,748 Cr). Lower mid AUM (₹14,026 Cr). Highest AUM (₹37,474 Cr). Point 2 Established history (19+ yrs). Established history (21+ yrs). Established history (18+ yrs). Oldest track record among peers (24 yrs). Established history (12+ yrs). Point 3 Rating: 2★ (bottom quartile). Rating: 2★ (bottom quartile). Rating: 3★ (upper mid). Top rated. Rating: 3★ (lower mid). Point 4 Risk profile: Moderately High. Risk profile: Moderately High. Risk profile: High. Risk profile: Moderately High. Risk profile: Moderately High. Point 5 5Y return: 19.19% (upper mid). 5Y return: 17.12% (bottom quartile). 5Y return: 17.97% (lower mid). 5Y return: 17.87% (bottom quartile). 5Y return: 21.68% (top quartile). Point 6 3Y return: 24.06% (top quartile). 3Y return: 21.81% (upper mid). 3Y return: 21.55% (lower mid). 3Y return: 20.33% (bottom quartile). 3Y return: 19.20% (bottom quartile). Point 7 1Y return: 10.22% (upper mid). 1Y return: 14.01% (top quartile). 1Y return: 9.21% (bottom quartile). 1Y return: 9.97% (lower mid). 1Y return: -1.65% (bottom quartile). Point 8 Alpha: 0.00 (lower mid). Alpha: 6.02 (top quartile). Alpha: -1.09 (bottom quartile). Alpha: 0.71 (upper mid). Alpha: -14.72 (bottom quartile). Point 9 Sharpe: 0.19 (upper mid). Sharpe: 0.32 (top quartile). Sharpe: -0.04 (bottom quartile). Sharpe: 0.06 (lower mid). Sharpe: -0.71 (bottom quartile). Point 10 Information ratio: 0.00 (bottom quartile). Information ratio: 0.87 (top quartile). Information ratio: 0.48 (upper mid). Information ratio: 0.32 (lower mid). Information ratio: -0.25 (bottom quartile). Invesco India Mid Cap Fund
ICICI Prudential MidCap Fund
Edelweiss Mid Cap Fund
Sundaram Mid Cap Fund
Motilal Oswal Midcap 30 Fund
سیکٹر فنڈز
یہ وہ فنڈز ہیں جو سیکٹر کے لیے مخصوص ہیں، یعنی وہ کسی خاص شعبے میں سرمایہ کاری کرتے ہیں جیسے انفرا، فارما، بینکنگ، جیسے۔ یہ ہائی رسک فنڈز ہیں، یہ آپ کے پیسے کو دوگنا یا پریشان کر سکتے ہیں۔ لہذا، سرمایہ کار جو اس شعبے کی مستقبل کی ترقی کے بارے میں جانتے ہیں کہ وہ سرمایہ کاری کرنا چاہتا ہے صرف ان فنڈز میں سرمایہ کاری کو ترجیح دینی چاہیے۔
Fund NAV Net Assets (Cr) 3 MO (%) 6 MO (%) 1 YR (%) 3 YR (%) 5 YR (%) 2025 (%) DSP Natural Resources and New Energy Fund Growth ₹106.327
↑ 0.33 ₹2,401 -4.7 0.4 18.3 19.2 15 17.5 BOI AXA Manufacturing and Infrastructure Fund Growth ₹66.6
↑ 0.16 ₹837 6.1 15 17.9 22.3 20.3 7.8 SBI Healthcare Opportunities Fund Growth ₹513.305
↑ 1.98 ₹4,998 16.9 26.5 16.3 23.1 17 -3.5 DSP India T.I.G.E.R Fund Growth ₹359.538
↑ 2.49 ₹6,264 4.5 16.6 15.1 21.2 21.6 -2.5 UTI Transportation & Logistics Fund Growth ₹300.36
↑ 3.32 ₹3,962 10.7 6.5 14 18.7 20.3 19.5 Note: Returns up to 1 year are on absolute basis & more than 1 year are on CAGR basis. as on 30 Jul 26 Research Highlights & Commentary of 5 Funds showcased
Commentary DSP Natural Resources and New Energy Fund BOI AXA Manufacturing and Infrastructure Fund SBI Healthcare Opportunities Fund DSP India T.I.G.E.R Fund UTI Transportation & Logistics Fund Point 1 Bottom quartile AUM (₹2,401 Cr). Bottom quartile AUM (₹837 Cr). Upper mid AUM (₹4,998 Cr). Highest AUM (₹6,264 Cr). Lower mid AUM (₹3,962 Cr). Point 2 Established history (18+ yrs). Established history (16+ yrs). Established history (21+ yrs). Oldest track record among peers (22 yrs). Established history (22+ yrs). Point 3 Top rated. Not Rated. Rating: 2★ (bottom quartile). Rating: 4★ (upper mid). Rating: 3★ (lower mid). Point 4 Risk profile: High. Risk profile: High. Risk profile: High. Risk profile: High. Risk profile: High. Point 5 5Y return: 14.99% (bottom quartile). 5Y return: 20.28% (upper mid). 5Y return: 16.97% (bottom quartile). 5Y return: 21.62% (top quartile). 5Y return: 20.25% (lower mid). Point 6 3Y return: 19.21% (bottom quartile). 3Y return: 22.25% (upper mid). 3Y return: 23.13% (top quartile). 3Y return: 21.24% (lower mid). 3Y return: 18.66% (bottom quartile). Point 7 1Y return: 18.33% (top quartile). 1Y return: 17.88% (upper mid). 1Y return: 16.28% (lower mid). 1Y return: 15.10% (bottom quartile). 1Y return: 14.00% (bottom quartile). Point 8 Alpha: 0.00 (upper mid). Alpha: 0.00 (lower mid). Alpha: 2.23 (top quartile). Alpha: 0.00 (bottom quartile). Alpha: 0.00 (bottom quartile). Point 9 Sharpe: 0.72 (top quartile). Sharpe: 0.53 (lower mid). Sharpe: 0.59 (upper mid). Sharpe: 0.44 (bottom quartile). Sharpe: 0.12 (bottom quartile). Point 10 Information ratio: 0.00 (top quartile). Information ratio: 0.00 (upper mid). Information ratio: -0.17 (bottom quartile). Information ratio: 0.00 (lower mid). Information ratio: 0.00 (bottom quartile). DSP Natural Resources and New Energy Fund
BOI AXA Manufacturing and Infrastructure Fund
SBI Healthcare Opportunities Fund
DSP India T.I.G.E.R Fund
UTI Transportation & Logistics Fund
Talk to our investment specialist
متنوع فنڈز یا ملٹی کیپ فنڈز
یہ فنڈز تمام جگہوں پر سرمایہ کاری کرتے ہیں۔مارکیٹ بڑی ٹوپی، مڈ اور سمال کیپ فنڈز۔ اس کی سرمایہ کاری کی تکنیک کی وجہ سے، وہ پورٹ فولیو کو متوازن کرنے میں مہارت رکھتے ہیں۔ جس کی وجہ سے خطرہ معتدل ہے۔ اگر ایک فنڈ اچھی کارکردگی کا مظاہرہ کرنے میں ناکام رہتا ہے، تو دوسرے پورٹ فولیو کو متوازن کرنے کے لیے موجود ہیں۔ سرمایہ کاروں کو مثالی طور پر کم از کم 5 سال اور اس سے زیادہ کے لیے سرمایہ کاری میں رہنا چاہیے۔
Fund NAV Net Assets (Cr) 3 MO (%) 6 MO (%) 1 YR (%) 3 YR (%) 5 YR (%) 2025 (%) Aditya Birla Sun Life Manufacturing Equity Fund Growth ₹38.44
↑ 0.31 ₹1,229 8.9 19.7 21.8 19.7 14.4 3.5 Motilal Oswal Multicap 35 Fund Growth ₹61.5094
↑ 0.31 ₹13,294 10.5 7 -0.3 18.7 12.4 -5.6 BNP Paribas Multi Cap Fund Growth ₹73.5154
↓ -0.01 ₹588 -4.6 -2.6 19.3 17.3 13.6 Mahindra Badhat Yojana Growth ₹38.4617
↑ 0.10 ₹6,926 6.7 9 8.7 16.8 15.3 3.4 ICICI Prudential Multicap Fund Growth ₹858.09
↑ 6.67 ₹18,194 5.2 9.7 8.1 16.5 15.3 5.7 Note: Returns up to 1 year are on absolute basis & more than 1 year are on CAGR basis. as on 31 Jul 26 Research Highlights & Commentary of 5 Funds showcased
Commentary Aditya Birla Sun Life Manufacturing Equity Fund Motilal Oswal Multicap 35 Fund BNP Paribas Multi Cap Fund Mahindra Badhat Yojana ICICI Prudential Multicap Fund Point 1 Bottom quartile AUM (₹1,229 Cr). Upper mid AUM (₹13,294 Cr). Bottom quartile AUM (₹588 Cr). Lower mid AUM (₹6,926 Cr). Highest AUM (₹18,194 Cr). Point 2 Established history (11+ yrs). Established history (12+ yrs). Established history (20+ yrs). Established history (9+ yrs). Oldest track record among peers (31 yrs). Point 3 Not Rated. Top rated. Rating: 4★ (upper mid). Not Rated. Rating: 3★ (lower mid). Point 4 Risk profile: High. Risk profile: Moderately High. Risk profile: Moderately High. Risk profile: Moderately High. Risk profile: Moderately High. Point 5 5Y return: 14.39% (lower mid). 5Y return: 12.41% (bottom quartile). 5Y return: 13.57% (bottom quartile). 5Y return: 15.32% (top quartile). 5Y return: 15.29% (upper mid). Point 6 3Y return: 19.72% (top quartile). 3Y return: 18.75% (upper mid). 3Y return: 17.28% (lower mid). 3Y return: 16.76% (bottom quartile). 3Y return: 16.48% (bottom quartile). Point 7 1Y return: 21.76% (top quartile). 1Y return: -0.33% (bottom quartile). 1Y return: 19.34% (upper mid). 1Y return: 8.75% (lower mid). 1Y return: 8.11% (bottom quartile). Point 8 Alpha: 0.00 (lower mid). Alpha: -7.36 (bottom quartile). Alpha: 0.00 (bottom quartile). Alpha: 4.46 (upper mid). Alpha: 6.49 (top quartile). Point 9 Sharpe: 0.54 (upper mid). Sharpe: -0.74 (bottom quartile). Sharpe: 2.86 (top quartile). Sharpe: 0.01 (bottom quartile). Sharpe: 0.09 (lower mid). Point 10 Information ratio: 0.00 (bottom quartile). Information ratio: 0.53 (lower mid). Information ratio: 0.00 (bottom quartile). Information ratio: 0.64 (top quartile). Information ratio: 0.61 (upper mid). Aditya Birla Sun Life Manufacturing Equity Fund
Motilal Oswal Multicap 35 Fund
BNP Paribas Multi Cap Fund
Mahindra Badhat Yojana
ICICI Prudential Multicap Fund
بڑے کیپ فنڈز
یہ وہ فنڈز ہیں جو ہندوستان میں بڑے سائز کی کمپنیوں میں سرمایہ کاری کرتے ہیں۔ یہ وہ فرمیں ہیں جو صنعت میں رہنما ہیں اور مستحکم منافع کے لیے مشہور ہیں۔ جیسا کہ، بڑے کیپ فنڈز بڑی کمپنیوں میں سرمایہ کاری کرتے ہیں وہ مڈ اور سمال کیپس کے مقابلے میں کم خطرناک ہوتے ہیں۔ لیکن، ایکویٹی فنڈ ہونے کی وجہ سے، اس کا خطرہ ہمیشہ موجود رہتا ہے۔ وہ سرمایہ کار جو اعتدال سے لے کر اعلیٰ سطح کا خطرہ برداشت کر سکتے ہیں اور 5 سال اور اس سے زیادہ کے لیے سرمایہ کاری کر سکتے ہیں وہ ان سکیموں میں سرمایہ کاری کر سکتے ہیں۔
Fund NAV Net Assets (Cr) 3 MO (%) 6 MO (%) 1 YR (%) 3 YR (%) 5 YR (%) 2025 (%) Nippon India Large Cap Fund Growth ₹90.5135
↑ 0.23 ₹53,227 2.1 -0.8 0.4 11.9 14.9 9.2 ICICI Prudential Bluechip Fund Growth ₹109.76
↑ 0.34 ₹79,421 2.9 -1.8 0 12.1 13.2 11.3 HDFC Top 100 Fund Growth ₹1,146.99
↑ 6.51 ₹39,024 5.1 0 1.5 10.3 12.9 7.9 IDBI India Top 100 Equity Fund Growth ₹44.16
↑ 0.05 ₹655 9.2 12.5 15.4 21.9 12.6 Invesco India Largecap Fund Growth ₹72.47
↑ 0.57 ₹1,847 7.5 5 5.9 13.5 12.1 5.5 Note: Returns up to 1 year are on absolute basis & more than 1 year are on CAGR basis. as on 31 Jul 26 Research Highlights & Commentary of 5 Funds showcased
Commentary Nippon India Large Cap Fund ICICI Prudential Bluechip Fund HDFC Top 100 Fund IDBI India Top 100 Equity Fund Invesco India Largecap Fund Point 1 Upper mid AUM (₹53,227 Cr). Highest AUM (₹79,421 Cr). Lower mid AUM (₹39,024 Cr). Bottom quartile AUM (₹655 Cr). Bottom quartile AUM (₹1,847 Cr). Point 2 Established history (18+ yrs). Established history (18+ yrs). Oldest track record among peers (29 yrs). Established history (14+ yrs). Established history (16+ yrs). Point 3 Top rated. Rating: 4★ (upper mid). Rating: 3★ (lower mid). Rating: 3★ (bottom quartile). Rating: 3★ (bottom quartile). Point 4 Risk profile: Moderately High. Risk profile: Moderately High. Risk profile: Moderately High. Risk profile: Moderately High. Risk profile: Moderately High. Point 5 5Y return: 14.95% (top quartile). 5Y return: 13.21% (upper mid). 5Y return: 12.86% (lower mid). 5Y return: 12.61% (bottom quartile). 5Y return: 12.12% (bottom quartile). Point 6 3Y return: 11.92% (bottom quartile). 3Y return: 12.13% (lower mid). 3Y return: 10.28% (bottom quartile). 3Y return: 21.88% (top quartile). 3Y return: 13.55% (upper mid). Point 7 1Y return: 0.41% (bottom quartile). 1Y return: -0.01% (bottom quartile). 1Y return: 1.47% (lower mid). 1Y return: 15.39% (top quartile). 1Y return: 5.93% (upper mid). Point 8 Alpha: 1.07 (lower mid). Alpha: -1.21 (bottom quartile). Alpha: -0.39 (bottom quartile). Alpha: 2.11 (upper mid). Alpha: 3.75 (top quartile). Point 9 Sharpe: -0.43 (lower mid). Sharpe: -0.55 (bottom quartile). Sharpe: -0.49 (bottom quartile). Sharpe: 1.09 (top quartile). Sharpe: -0.25 (upper mid). Point 10 Information ratio: 0.98 (top quartile). Information ratio: 0.85 (upper mid). Information ratio: 0.08 (bottom quartile). Information ratio: 0.14 (bottom quartile). Information ratio: 0.82 (lower mid). Nippon India Large Cap Fund
ICICI Prudential Bluechip Fund
HDFC Top 100 Fund
IDBI India Top 100 Equity Fund
Invesco India Largecap Fund
To generate capital appreciation and income distribution to unit holders by investing predominantly in equity/equity related securities of the companies belonging to the infrastructure development and balance in debt securities and money market instruments. Below is the key information for ICICI Prudential Infrastructure Fund Returns up to 1 year are on The objective of the scheme would be to provide investors with opportunities for long-term growth in capital along with the liquidity of an open-ended scheme through an active management of investments in a diversified basket of equity stocks of domestic Public Sector Undertakings and in debt and money market instruments issued by PSUs AND others. Research Highlights for SBI PSU Fund Below is the key information for SBI PSU Fund Returns up to 1 year are on The investment objective of the scheme is to provide long term growth from a portfolio of equity / equity related instruments of companies engaged either directly or indirectly in the infrastructure sector. Research Highlights for LIC MF Infrastructure Fund Below is the key information for LIC MF Infrastructure Fund Returns up to 1 year are on "The primary investment objective of the Scheme is to seek capital appreciation by investing predominantly in units of MLIIF - WGF. The Scheme may, at the discretion of the Investment Manager, also invest in the units of other similar overseas mutual fund schemes, which may constitute a significant part of its corpus. The Scheme may also invest a certain portion of its corpus in money market securities and/or units of money market/liquid schemes of DSP Merrill Lynch Mutual Fund, in order to meet liquidity requirements from time to time. However, there is no assurance that the investment objective of the Scheme will be realized." Research Highlights for DSP World Gold Fund Below is the key information for DSP World Gold Fund Returns up to 1 year are on (Erstwhile Reliance Diversified Power Sector Fund) The primary investment objective of the scheme is to generate long term capital appreciation by investing predominantly in equity and equity related securities of companies in the power sector. Research Highlights for Nippon India Power and Infra Fund Below is the key information for Nippon India Power and Infra Fund Returns up to 1 year are on 1. ICICI Prudential Infrastructure Fund
ICICI Prudential Infrastructure Fund
Growth Launch Date 31 Aug 05 NAV (31 Jul 26) ₹202.51 ↑ 0.83 (0.41 %) Net Assets (Cr) ₹8,550 on 30 Jun 26 Category Equity - Sectoral AMC ICICI Prudential Asset Management Company Limited Rating ☆☆☆ Risk High Expense Ratio 1.89 Sharpe Ratio -0.07 Information Ratio 0 Alpha Ratio 0 Min Investment 5,000 Min SIP Investment 100 Exit Load 0-1 Years (1%),1 Years and above(NIL) Growth of 10,000 investment over the years.
Date Value 31 Jul 21 ₹10,000 31 Jul 22 ₹11,961 31 Jul 23 ₹16,935 31 Jul 24 ₹27,533 31 Jul 25 ₹26,878 31 Jul 26 ₹28,111 Returns for ICICI Prudential Infrastructure Fund
absolute basis & more than 1 year are on CAGR (Compound Annual Growth Rate) basis. as on 31 Jul 26 Duration Returns 1 Month -0.8% 3 Month 1.1% 6 Month 5.4% 1 Year 4.6% 3 Year 18.4% 5 Year 23% 10 Year 15 Year Since launch 15.5% Historical performance (Yearly) on absolute basis
Year Returns 2025 6.7% 2024 27.4% 2023 44.6% 2022 28.8% 2021 50.1% 2020 3.6% 2019 2.6% 2018 -14% 2017 40.8% 2016 2% Fund Manager information for ICICI Prudential Infrastructure Fund
Name Since Tenure Ihab Dalwai 3 Jun 17 9.08 Yr. Sharmila D’mello 30 Jun 22 4.01 Yr. Data below for ICICI Prudential Infrastructure Fund as on 30 Jun 26
Equity Sector Allocation
Sector Value Industrials 47.57% Financial Services 10.57% Utility 10.32% Basic Materials 9.74% Real Estate 8.09% Energy 5.04% Consumer Cyclical 1.98% Communication Services 0.09% Asset Allocation
Asset Class Value Cash 5.83% Equity 94.17% Top Securities Holdings / Portfolio
Name Holding Value Quantity InterGlobe Aviation Ltd (Industrials)
Equity, Since 28 Feb 23 | INDIGO9% ₹745 Cr 1,691,985
↑ 50,000 Larsen & Toubro Ltd (Industrials)
Equity, Since 30 Nov 09 | LT7% ₹614 Cr 1,505,704 Oberoi Realty Ltd (Real Estate)
Equity, Since 31 May 23 | OBEROIRLTY4% ₹365 Cr 2,139,426 Gujarat Energy Ltd (Utilities)
Equity, Since 31 Jan 23 | GUJGASLTD4% ₹340 Cr 8,482,024
↑ 156,557 NTPC Ltd (Utilities)
Equity, Since 29 Feb 16 | NTPC4% ₹334 Cr 8,626,448 Shree Cement Ltd (Basic Materials)
Equity, Since 30 Apr 24 | SHREECEM3% ₹270 Cr 106,892
↑ 3,387 Kalpataru Projects International Ltd (Industrials)
Equity, Since 30 Sep 06 | KPIL3% ₹262 Cr 2,005,608 AIA Engineering Ltd (Industrials)
Equity, Since 28 Feb 21 | AIAENG3% ₹258 Cr 572,697 HDFC Bank Ltd (Financial Services)
Equity, Since 31 Jan 22 | HDFCBANK3% ₹250 Cr 3,357,506
↑ 1,057,506 Container Corporation of India Ltd (Industrials)
Equity, Since 31 Jan 16 | CONCOR3% ₹227 Cr 4,885,153 2. SBI PSU Fund
SBI PSU Fund
Growth Launch Date 7 Jul 10 NAV (31 Jul 26) ₹34.3228 ↑ 0.27 (0.79 %) Net Assets (Cr) ₹6,684 on 30 Jun 26 Category Equity - Sectoral AMC SBI Funds Management Private Limited Rating ☆☆ Risk High Expense Ratio 1.89 Sharpe Ratio 0.12 Information Ratio -0.11 Alpha Ratio -0.3 Min Investment 5,000 Min SIP Investment 500 Exit Load 0-1 Years (1%),1 Years and above(NIL) Growth of 10,000 investment over the years.
Date Value 31 Jul 21 ₹10,000 31 Jul 22 ₹10,878 31 Jul 23 ₹15,287 31 Jul 24 ₹28,684 31 Jul 25 ₹25,557 31 Jul 26 ₹28,011 Returns for SBI PSU Fund
absolute basis & more than 1 year are on CAGR (Compound Annual Growth Rate) basis. as on 31 Jul 26 Duration Returns 1 Month -0.8% 3 Month -4.4% 6 Month -1.7% 1 Year 9.6% 3 Year 22.4% 5 Year 22.9% 10 Year 15 Year Since launch 8% Historical performance (Yearly) on absolute basis
Year Returns 2025 11.3% 2024 23.5% 2023 54% 2022 29% 2021 32.4% 2020 -10% 2019 6% 2018 -23.8% 2017 21.9% 2016 16.2% Fund Manager information for SBI PSU Fund
Name Since Tenure Rohit Shimpi 1 Jun 24 2.08 Yr. Data below for SBI PSU Fund as on 30 Jun 26
Equity Sector Allocation
Sector Value Financial Services 32.54% Utility 31.22% Industrials 14.07% Energy 11.97% Basic Materials 6.94% Asset Allocation
Asset Class Value Cash 3.18% Equity 96.74% Debt 0.07% Top Securities Holdings / Portfolio
Name Holding Value Quantity State Bank of India (Financial Services)
Equity, Since 31 Jul 10 | SBIN17% ₹1,112 Cr 11,527,500
↑ 1,000,000 GAIL (India) Ltd (Utilities)
Equity, Since 31 May 24 | GAIL10% ₹628 Cr 38,150,000 NTPC Ltd (Utilities)
Equity, Since 31 Jul 10 | NTPC9% ₹597 Cr 15,443,244 Bharat Electronics Ltd (Industrials)
Equity, Since 30 Jun 24 | BEL9% ₹583 Cr 14,185,000
↑ 800,000 Power Grid Corp Of India Ltd (Utilities)
Equity, Since 31 Jul 10 | POWERGRID9% ₹579 Cr 19,935,554 Oil & Natural Gas Corp Ltd (Energy)
Equity, Since 31 May 20 | ONGC6% ₹389 Cr 14,655,000 Bank of Baroda (Financial Services)
Equity, Since 31 Aug 24 | BANKBARODA5% ₹352 Cr 13,100,000 Bharat Petroleum Corp Ltd (Energy)
Equity, Since 31 Aug 24 | BPCL4% ₹289 Cr 9,700,000 Bharat Heavy Electricals Ltd (Industrials)
Equity, Since 30 Jun 25 | BHEL4% ₹271 Cr 6,500,000 NMDC Ltd (Basic Materials)
Equity, Since 31 Oct 23 | NMDC4% ₹245 Cr 27,900,000 3. LIC MF Infrastructure Fund
LIC MF Infrastructure Fund
Growth Launch Date 29 Feb 08 NAV (31 Jul 26) ₹54.5662 ↑ 0.75 (1.39 %) Net Assets (Cr) ₹1,137 on 30 Jun 26 Category Equity - Sectoral AMC LIC Mutual Fund Asset Mgmt Co Ltd Rating Risk High Expense Ratio 2.21 Sharpe Ratio 0.22 Information Ratio 0.58 Alpha Ratio 8.41 Min Investment 5,000 Min SIP Investment 1,000 Exit Load 0-1 Years (1%),1 Years and above(NIL) Growth of 10,000 investment over the years.
Date Value 31 Jul 21 ₹10,000 31 Jul 22 ₹11,519 31 Jul 23 ₹14,236 31 Jul 24 ₹26,350 31 Jul 25 ₹25,021 31 Jul 26 ₹27,470 Returns for LIC MF Infrastructure Fund
absolute basis & more than 1 year are on CAGR (Compound Annual Growth Rate) basis. as on 31 Jul 26 Duration Returns 1 Month -0.9% 3 Month 5.3% 6 Month 14.5% 1 Year 9.8% 3 Year 24.5% 5 Year 22.4% 10 Year 15 Year Since launch 9.7% Historical performance (Yearly) on absolute basis
Year Returns 2025 -3.7% 2024 47.8% 2023 44.4% 2022 7.9% 2021 46.6% 2020 -0.1% 2019 13.3% 2018 -14.6% 2017 42.2% 2016 -2.2% Fund Manager information for LIC MF Infrastructure Fund
Name Since Tenure Sumit Bhatnagar 7 Apr 26 0.23 Yr. Mahesh Bendre 1 Jul 24 2 Yr. Data below for LIC MF Infrastructure Fund as on 30 Jun 26
Equity Sector Allocation
Sector Value Industrials 37.05% Consumer Cyclical 20.88% Basic Materials 12.42% Utility 11.88% Communication Services 5.02% Financial Services 3.98% Real Estate 1.97% Health Care 1.89% Technology 1.08% Asset Allocation
Asset Class Value Cash 3.82% Equity 96.18% Top Securities Holdings / Portfolio
Name Holding Value Quantity Larsen & Toubro Ltd (Industrials)
Equity, Since 30 Apr 09 | LT4% ₹44 Cr 106,968
↓ -10,884 Garware Hi-Tech Films Ltd (Basic Materials)
Equity, Since 31 Aug 23 | 5006554% ₹40 Cr 65,325
↓ -7,684 Tata Motors Passenger Vehicles Ltd (Consumer Cyclical)
Equity, Since 28 Feb 26 | TMPV4% ₹39 Cr 982,891
↓ -332,760 Tata Motors Ltd (Consumer Cyclical)
Equity, Since 31 Oct 25 | TMCV4% ₹39 Cr 1,015,933
↑ 26,983 Tata Power Co Ltd (Utilities)
Equity, Since 29 Feb 24 | TATAPOWER3% ₹36 Cr 861,040
↑ 524,312 KSH International Ltd (Industrials)
Equity, Since 31 Dec 25 | KSHINTL3% ₹34 Cr 432,816
↑ 6,280 Siemens Energy India Ltd (Utilities)
Equity, Since 31 Aug 25 | ENRIN3% ₹34 Cr 87,106
↑ 24,800 JSW Infrastructure Ltd (Industrials)
Equity, Since 30 Apr 26 | JSWINFRA3% ₹31 Cr 1,133,858
↑ 745,681 Carraro India Ltd (Consumer Cyclical)
Equity, Since 31 Dec 24 | CARRARO3% ₹31 Cr 572,991 Bharat Dynamics Ltd Ordinary Shares (Industrials)
Equity, Since 31 Jan 26 | BDL3% ₹29 Cr 242,954
↑ 157,744 4. DSP World Gold Fund
DSP World Gold Fund
Growth Launch Date 14 Sep 07 NAV (30 Jul 26) ₹50.4247 ↑ 1.63 (3.33 %) Net Assets (Cr) ₹1,433 on 30 Jun 26 Category Equity - Global AMC DSP BlackRock Invmt Managers Pvt. Ltd. Rating ☆☆☆ Risk High Expense Ratio 1.41 Sharpe Ratio 1.22 Information Ratio -0.5 Alpha Ratio 2.12 Min Investment 1,000 Min SIP Investment 500 Exit Load 0-12 Months (1%),12 Months and above(NIL) Growth of 10,000 investment over the years.
Date Value 31 Jul 21 ₹10,000 31 Jul 22 ₹7,373 31 Jul 23 ₹9,366 31 Jul 24 ₹11,150 31 Jul 25 ₹16,504 31 Jul 26 ₹26,355 Returns for DSP World Gold Fund
absolute basis & more than 1 year are on CAGR (Compound Annual Growth Rate) basis. as on 31 Jul 26 Duration Returns 1 Month 2.3% 3 Month -12.7% 6 Month -17.8% 1 Year 62.8% 3 Year 43.6% 5 Year 22.1% 10 Year 15 Year Since launch 8.9% Historical performance (Yearly) on absolute basis
Year Returns 2025 167.1% 2024 15.9% 2023 7% 2022 -7.7% 2021 -9% 2020 31.4% 2019 35.1% 2018 -10.7% 2017 -4% 2016 52.7% Fund Manager information for DSP World Gold Fund
Name Since Tenure Kaivalya Nadkarni 1 May 25 1.17 Yr. Data below for DSP World Gold Fund as on 30 Jun 26
Equity Sector Allocation
Sector Value Basic Materials 94.47% Asset Allocation
Asset Class Value Cash 3.62% Equity 94.47% Debt 0% Other 1.91% Top Securities Holdings / Portfolio
Name Holding Value Quantity BGF World Gold I2
Investment Fund | -68% ₹1,141 Cr 1,005,044 VanEck Gold Miners ETF
- | GDX29% ₹490 Cr 573,719 Treps / Reverse Repo Investments
CBLO/Reverse Repo | -3% ₹54 Cr Net Receivables/Payables
Net Current Assets | -0% -₹6 Cr 5. Nippon India Power and Infra Fund
Nippon India Power and Infra Fund
Growth Launch Date 8 May 04 NAV (31 Jul 26) ₹381.086 ↑ 3.66 (0.97 %) Net Assets (Cr) ₹8,043 on 30 Jun 26 Category Equity - Sectoral AMC Nippon Life Asset Management Ltd. Rating ☆☆☆☆ Risk High Expense Ratio 1.85 Sharpe Ratio 0.24 Information Ratio 0.56 Alpha Ratio 8.81 Min Investment 5,000 Min SIP Investment 100 Exit Load 0-1 Years (1%),1 Years and above(NIL) Growth of 10,000 investment over the years.
Date Value 31 Jul 21 ₹10,000 31 Jul 22 ₹10,666 31 Jul 23 ₹15,659 31 Jul 24 ₹26,918 31 Jul 25 ₹24,246 31 Jul 26 ₹27,001 Returns for Nippon India Power and Infra Fund
absolute basis & more than 1 year are on CAGR (Compound Annual Growth Rate) basis. as on 31 Jul 26 Duration Returns 1 Month -0.8% 3 Month 0.6% 6 Month 14% 1 Year 11.4% 3 Year 19.9% 5 Year 22% 10 Year 15 Year Since launch 17.8% Historical performance (Yearly) on absolute basis
Year Returns 2025 -0.5% 2024 26.9% 2023 58% 2022 10.9% 2021 48.9% 2020 10.8% 2019 -2.9% 2018 -21.1% 2017 61.7% 2016 0.1% Fund Manager information for Nippon India Power and Infra Fund
Name Since Tenure Kinjal Desai 25 May 18 8.11 Yr. Rahul Modi 19 Aug 24 1.87 Yr. Amber Singhania 11 Mar 26 0.31 Yr. Data below for Nippon India Power and Infra Fund as on 30 Jun 26
Equity Sector Allocation
Sector Value Industrials 34.92% Utility 22.36% Consumer Cyclical 11.45% Energy 9.18% Basic Materials 6.78% Technology 4.51% Financial Services 4.09% Communication Services 2.39% Real Estate 1.47% Health Care 1.24% Asset Allocation
Asset Class Value Cash 1.59% Equity 98.41% Top Securities Holdings / Portfolio
Name Holding Value Quantity Reliance Industries Ltd (Energy)
Equity, Since 30 Nov 18 | RELIANCE8% ₹616 Cr 4,660,000 Larsen & Toubro Ltd (Industrials)
Equity, Since 30 Nov 07 | LT7% ₹557 Cr 1,366,958
↑ 20,000 NTPC Ltd (Utilities)
Equity, Since 31 May 09 | NTPC6% ₹487 Cr 12,600,000
↓ -554,060 NTPC Green Energy Ltd (Utilities)
Equity, Since 30 Nov 24 | NTPCGREEN4% ₹296 Cr 28,594,584
↑ 2,403,505 Tata Power Co Ltd (Utilities)
Equity, Since 30 Apr 23 | TATAPOWER3% ₹246 Cr 5,850,789
↓ -100,000 Bharat Heavy Electricals Ltd (Industrials)
Equity, Since 30 Sep 24 | BHEL3% ₹242 Cr 5,800,000
↓ -1,148,468 Triveni Turbine Ltd (Industrials)
Equity, Since 30 Jun 25 | TRITURBINE3% ₹237 Cr 3,193,288
↑ 120,000 Power Finance Corp Ltd (Financial Services)
Equity, Since 31 Oct 24 | PFC3% ₹198 Cr 4,620,000
↑ 720,000 Bharti Airtel Ltd (Communication Services)
Equity, Since 30 Apr 18 | BHARTIARTL2% ₹188 Cr 1,030,000
↑ 180,000 CG Power & Industrial Solutions Ltd (Industrials)
Equity, Since 30 Sep 24 | CGPOWER2% ₹174 Cr 1,893,400
↓ -276,614
ہائی رسک انویسٹمنٹس میں ایس آئی پی کا راستہ اختیار کرنا اسمارٹ چوائس کیوں ہے؟
ایک منظمسرمایہ کاری کا منصوبہ (گھونٹ) میوچل فنڈز میں سرمایہ کاری کا ایک موثر طریقہ ہے، خاص طور پر ایکویٹی فنڈز میں۔ ایک SIP اجازت دیتا ہے۔سرمایہ کار اسکیم میں باقاعدگی سے ایک مقررہ رقم کی سرمایہ کاری کرنا۔ SIPs کا ایک اہم فائدہ یہ ہے کہ یہ روپے کی اوسط لاگت میں مدد کرتا ہے۔ جب آپ مارکیٹ کے حالات سے قطع نظر، وقت کی ایک مدت میں باقاعدگی سے سرمایہ کاری کرتے ہیں، تو آپ کو زیادہ یونٹس ملیں گے جب مارکیٹ کم ہو اور جب مارکیٹ زیادہ ہو تو کم یونٹس۔ یہ آپ کے میوچل فنڈ یونٹس کی خریداری کی قیمت کا اوسط نکالتا ہے۔
دوسرا فائدہ یہ ہے۔کمپاؤنڈنگ کی طاقت. جب آپ طویل مدت کے لیے سرمایہ کاری کرتے ہیں تو آپ کا پیسہ بڑھنا شروع ہو جاتا ہے۔ جمع شدہ کارپس مارکیٹ میں دوبارہ سرمایہ کاری کی جاتی ہے اور آپ اپنی سرمایہ کاری سے حاصل ہونے والے منافع پر منافع کماتے ہیں۔ اس سے ایک بڑا کارپس بنانے میں مدد ملتی ہے جو آپ کو باقاعدہ چھوٹی سرمایہ کاری کے ساتھ اپنے طویل مدتی اہداف کو حاصل کرنے میں مدد دے سکتا ہے۔
SIP کے دیگر فوائد میں سے کچھ یہ ہیں:
- کم از کم سرمایہ کاری INR 500 سے شروع ہوتی ہے۔
- طویل مدتی بچت کی عادت بناتا ہے۔
- طویل مدتی خطرے کو کم کرتا ہے۔
- مقصد کے مطابق سرمایہ کاری میں مدد کرتا ہے۔
ہائی رسک میوچل فنڈز میں کیسے سرمایہ کاری کی جائے؟
Fincash.com پر لائف ٹائم کے لیے مفت انویسٹمنٹ اکاؤنٹ کھولیں۔
اپنی رجسٹریشن اور KYC کا عمل مکمل کریں۔
دستاویزات اپ لوڈ کریں (PAN، آدھار، وغیرہ)۔اور، آپ سرمایہ کاری کے لیے تیار ہیں!
یہاں فراہم کردہ معلومات کے درست ہونے کو یقینی بنانے کے لیے تمام کوششیں کی گئی ہیں۔ تاہم، ڈیٹا کی درستگی کے حوالے سے کوئی ضمانت نہیں دی جاتی ہے۔ براہ کرم کوئی بھی سرمایہ کاری کرنے سے پہلے اسکیم کی معلومات کے دستاویز کے ساتھ تصدیق کریں۔


AMFI Registration No. 112358 | CIN: U74999MH2016PTC282153
Shepard Technologies Pvt. Ltd. (with ARN code 112358) makes no warranties or representations, express or implied, on products offered through the platform. It accepts no liability for any damages or losses, however caused, in connection with the use of, or on the reliance of its product or related services. Terms and conditions of the website are applicable.
©2026 Shepard Technologies Private Limited. All Rights Reserved
Research Highlights for ICICI Prudential Infrastructure Fund