2022 માં રોકાણ કરવા માટે ટોચના 5 મ્યુચ્યુઅલ ફંડ
મ્યુચ્યુઅલ ફંડ મોડેથી રોકાણનું લોકપ્રિય માધ્યમ બની ગયું છે અને ઘણા રોકાણકારો આ તરફ ઝુકાવતા હોય છેરોકાણ તેમાં. મ્યુચ્યુઅલ ફંડ માત્ર સારું વળતર જ આપતા નથી, પરંતુ તે હાંસલ કરવાની વ્યવસ્થિત તક પણ આપે છેનાણાકીય લક્ષ્યો, જે તાજેતરના સમયમાં તેમની લોકપ્રિયતાનું એક કારણ છે. જો કે, ઇચ્છિત રોકાણ લક્ષ્ય હાંસલ કરવા અથવા સારું વળતર મેળવવા માટે, યોગ્ય ફંડમાં રોકાણ કરવું મહત્વપૂર્ણ છે. તેથી જ અમે અહીં છીએ! રોકાણકારો આયોજન કરી રહ્યા છેમ્યુચ્યુઅલ ફંડમાં રોકાણ કરો, અમે તમને કેટલાક લાવીએ છીએશ્રેષ્ઠ પ્રદર્શન કરનાર મ્યુચ્યુઅલ ફંડ જે તમારે રોકાણ કરતી વખતે ધ્યાનમાં લેવાની જરૂર છે. આ ભંડોળને એયુએમ જેવા મહત્વના પરિમાણો હાથ ધરીને શોર્ટલિસ્ટ કરવામાં આવ્યા છે.નથી, ભૂતકાળનું પ્રદર્શન, પીઅર સરેરાશ વળતર, માહિતી ગુણોત્તર, વગેરે.
Talk to our investment specialist
ભારતમાં ટોચના 5 શ્રેષ્ઠ પ્રદર્શન કરતા મ્યુચ્યુઅલ ફંડ્સ
શ્રેષ્ઠ ઇક્વિટી મ્યુચ્યુઅલ ફંડ્સ 2022
Fund NAV Net Assets (Cr) Min Investment Min SIP Investment 3 MO (%) 6 MO (%) 1 YR (%) 3 YR (%) 5 YR (%) 2025 (%) Information Ratio Sharpe Ratio DSP World Gold Fund Growth ₹50.4247
↑ 1.63 ₹1,433 1,000 500 -12.7 -17.8 62.8 43.6 22.1 167.1 -0.5 1.22 DSP US Flexible Equity Fund Growth ₹90.0193
↑ 0.77 ₹1,291 1,000 500 1.5 11.7 36.9 24.6 17.2 33.8 0.15 1.93 LIC MF Infrastructure Fund Growth ₹54.5662
↑ 0.75 ₹1,137 5,000 1,000 5.3 14.5 9.8 24.5 22.4 -3.7 0.58 0.22 Invesco India Mid Cap Fund Growth ₹197.72
↑ 0.24 ₹13,767 5,000 500 10.5 14.9 10.2 24.1 19.2 6.3 0 0.19 UTI Healthcare Fund Growth ₹334.51
↑ 0.45 ₹1,308 5,000 500 14.3 22.9 12.7 23.2 14.7 -3.1 0.2 0.58 Note: Returns up to 1 year are on absolute basis & more than 1 year are on CAGR basis. as on 30 Jul 26 Note: Ratio's shown as on 30 Jun 26 Research Highlights & Commentary of 5 Funds showcased
Commentary DSP World Gold Fund DSP US Flexible Equity Fund LIC MF Infrastructure Fund Invesco India Mid Cap Fund UTI Healthcare Fund Point 1 Upper mid AUM (₹1,433 Cr). Bottom quartile AUM (₹1,291 Cr). Bottom quartile AUM (₹1,137 Cr). Highest AUM (₹13,767 Cr). Lower mid AUM (₹1,308 Cr). Point 2 Established history (18+ yrs). Established history (14+ yrs). Established history (18+ yrs). Established history (19+ yrs). Oldest track record among peers (27 yrs). Point 3 Rating: 3★ (upper mid). Top rated. Not Rated. Rating: 2★ (lower mid). Rating: 1★ (bottom quartile). Point 4 Risk profile: High. Risk profile: High. Risk profile: High. Risk profile: Moderately High. Risk profile: High. Point 5 5Y return: 22.15% (upper mid). 5Y return: 17.19% (bottom quartile). 5Y return: 22.40% (top quartile). 5Y return: 19.19% (lower mid). 5Y return: 14.70% (bottom quartile). Point 6 3Y return: 43.62% (top quartile). 3Y return: 24.61% (upper mid). 3Y return: 24.50% (lower mid). 3Y return: 24.06% (bottom quartile). 3Y return: 23.21% (bottom quartile). Point 7 1Y return: 62.77% (top quartile). 1Y return: 36.94% (upper mid). 1Y return: 9.79% (bottom quartile). 1Y return: 10.22% (bottom quartile). 1Y return: 12.75% (lower mid). Point 8 Alpha: 2.12 (lower mid). Alpha: -4.10 (bottom quartile). Alpha: 8.41 (top quartile). Alpha: 0.00 (bottom quartile). Alpha: 2.15 (upper mid). Point 9 Sharpe: 1.22 (upper mid). Sharpe: 1.93 (top quartile). Sharpe: 0.22 (bottom quartile). Sharpe: 0.19 (bottom quartile). Sharpe: 0.58 (lower mid). Point 10 Information ratio: -0.50 (bottom quartile). Information ratio: 0.15 (lower mid). Information ratio: 0.58 (top quartile). Information ratio: 0.00 (bottom quartile). Information ratio: 0.20 (upper mid). DSP World Gold Fund
DSP US Flexible Equity Fund
LIC MF Infrastructure Fund
Invesco India Mid Cap Fund
UTI Healthcare Fund
શ્રેષ્ઠ ડેટ ફંડ્સ 2022
Fund NAV Net Assets (Cr) 3 MO (%) 6 MO (%) 1 YR (%) 3 YR (%) 2025 (%) Debt Yield (YTM) Mod. Duration Eff. Maturity Franklin India Ultra Short Bond Fund - Super Institutional Plan Growth ₹34.9131
↑ 0.04 ₹297 1.3 5.9 13.7 8.8 0% 1Y 15D Sundaram Short Term Debt Fund Growth ₹36.3802
↑ 0.01 ₹362 0.8 11.4 12.8 5.3 4.52% 1Y 2M 13D 1Y 7M 3D Aditya Birla Sun Life Credit Risk Fund Growth ₹25.2587
↑ 0.01 ₹1,461 2.7 4.8 11.9 12.2 13.4 7.98% 2Y 29D 2Y 9M 4D Sundaram Low Duration Fund Growth ₹28.8391
↑ 0.01 ₹550 1 10.2 11.8 5 4.19% 5M 18D 8M 1D DSP Credit Risk Fund Growth ₹54.9552
↑ 0.01 ₹275 2.9 8.1 10.1 16 21 7.73% 2Y 1M 28D 2Y 10M 17D Note: Returns up to 1 year are on absolute basis & more than 1 year are on CAGR basis. as on 7 Aug 22 Research Highlights & Commentary of 5 Funds showcased
Commentary Franklin India Ultra Short Bond Fund - Super Institutional Plan Sundaram Short Term Debt Fund Aditya Birla Sun Life Credit Risk Fund Sundaram Low Duration Fund DSP Credit Risk Fund Point 1 Bottom quartile AUM (₹297 Cr). Lower mid AUM (₹362 Cr). Highest AUM (₹1,461 Cr). Upper mid AUM (₹550 Cr). Bottom quartile AUM (₹275 Cr). Point 2 Established history (18+ yrs). Oldest track record among peers (23 yrs). Established history (11+ yrs). Established history (19+ yrs). Established history (23+ yrs). Point 3 Rating: 1★ (bottom quartile). Rating: 2★ (upper mid). Not Rated. Rating: 2★ (lower mid). Top rated. Point 4 Risk profile: Moderate. Risk profile: Moderately Low. Risk profile: Moderate. Risk profile: Moderately Low. Risk profile: Moderate. Point 5 1Y return: 13.69% (top quartile). 1Y return: 12.83% (upper mid). 1Y return: 11.87% (lower mid). 1Y return: 11.79% (bottom quartile). 1Y return: 10.15% (bottom quartile). Point 6 1M return: 0.59% (top quartile). 1M return: 0.20% (bottom quartile). 1M return: 0.47% (upper mid). 1M return: 0.28% (bottom quartile). 1M return: 0.34% (lower mid). Point 7 Sharpe: 2.57 (top quartile). Sharpe: 0.98 (bottom quartile). Sharpe: 1.95 (upper mid). Sharpe: 0.99 (lower mid). Sharpe: 0.76 (bottom quartile). Point 8 Information ratio: 0.00 (top quartile). Information ratio: 0.00 (upper mid). Information ratio: 0.00 (lower mid). Information ratio: 0.00 (bottom quartile). Information ratio: 0.00 (bottom quartile). Point 9 Yield to maturity (debt): 0.00% (bottom quartile). Yield to maturity (debt): 4.52% (lower mid). Yield to maturity (debt): 7.98% (top quartile). Yield to maturity (debt): 4.19% (bottom quartile). Yield to maturity (debt): 7.73% (upper mid). Point 10 Modified duration: 0.00 yrs (top quartile). Modified duration: 1.20 yrs (lower mid). Modified duration: 2.08 yrs (bottom quartile). Modified duration: 0.47 yrs (upper mid). Modified duration: 2.16 yrs (bottom quartile). Franklin India Ultra Short Bond Fund - Super Institutional Plan
Sundaram Short Term Debt Fund
Aditya Birla Sun Life Credit Risk Fund
Sundaram Low Duration Fund
DSP Credit Risk Fund
શ્રેષ્ઠ હાઇબ્રિડ ફંડ્સ 2022
Fund NAV Net Assets (Cr) 3 MO (%) 6 MO (%) 1 YR (%) 3 YR (%) 5 YR (%) 2025 (%) BOI AXA Mid and Small Cap Equity and Debt Fund Growth ₹41.84
↑ 0.20 ₹1,695 4.5 10.7 9.8 16.8 13.8 -0.9 Sundaram Equity Hybrid Fund Growth ₹135.137
↑ 0.78 ₹1,954 0.5 10.5 27.1 16 14.2 UTI Multi Asset Fund Growth ₹79.0729
↑ 0.14 ₹6,890 2.3 -0.6 7.1 15.2 13.4 11.1 SBI Multi Asset Allocation Fund Growth ₹66.5157
↓ -0.09 ₹19,354 0.8 -0.6 11.5 15.2 13.1 18.6 ICICI Prudential Multi-Asset Fund Growth ₹813.375
↑ 1.67 ₹84,991 1.7 -0.7 7.6 15 16.9 18.6 Note: Returns up to 1 year are on absolute basis & more than 1 year are on CAGR basis. as on 31 Jul 26 Research Highlights & Commentary of 5 Funds showcased
Commentary BOI AXA Mid and Small Cap Equity and Debt Fund Sundaram Equity Hybrid Fund UTI Multi Asset Fund SBI Multi Asset Allocation Fund ICICI Prudential Multi-Asset Fund Point 1 Bottom quartile AUM (₹1,695 Cr). Bottom quartile AUM (₹1,954 Cr). Lower mid AUM (₹6,890 Cr). Upper mid AUM (₹19,354 Cr). Highest AUM (₹84,991 Cr). Point 2 Established history (10+ yrs). Oldest track record among peers (26 yrs). Established history (17+ yrs). Established history (20+ yrs). Established history (23+ yrs). Point 3 Not Rated. Rating: 2★ (upper mid). Rating: 1★ (bottom quartile). Top rated. Rating: 2★ (lower mid). Point 4 Risk profile: Moderately High. Risk profile: Moderately High. Risk profile: Moderately High. Risk profile: Moderate. Risk profile: Moderately High. Point 5 5Y return: 13.77% (lower mid). 5Y return: 14.20% (upper mid). 5Y return: 13.37% (bottom quartile). 5Y return: 13.07% (bottom quartile). 5Y return: 16.90% (top quartile). Point 6 3Y return: 16.84% (top quartile). 3Y return: 16.03% (upper mid). 3Y return: 15.23% (lower mid). 3Y return: 15.18% (bottom quartile). 3Y return: 15.00% (bottom quartile). Point 7 1Y return: 9.85% (lower mid). 1Y return: 27.10% (top quartile). 1Y return: 7.13% (bottom quartile). 1Y return: 11.52% (upper mid). 1Y return: 7.61% (bottom quartile). Point 8 1M return: 0.34% (bottom quartile). 1M return: 1.80% (upper mid). 1M return: 2.16% (top quartile). 1M return: 0.26% (bottom quartile). 1M return: 1.66% (lower mid). Point 9 Alpha: 0.00 (upper mid). Alpha: 5.81 (top quartile). Alpha: 0.00 (lower mid). Alpha: 0.00 (bottom quartile). Alpha: 0.00 (bottom quartile). Point 10 Sharpe: 0.17 (lower mid). Sharpe: 2.64 (top quartile). Sharpe: -0.11 (bottom quartile). Sharpe: 0.53 (upper mid). Sharpe: 0.01 (bottom quartile). BOI AXA Mid and Small Cap Equity and Debt Fund
Sundaram Equity Hybrid Fund
UTI Multi Asset Fund
SBI Multi Asset Allocation Fund
ICICI Prudential Multi-Asset Fund
શ્રેષ્ઠ ગોલ્ડ મ્યુચ્યુઅલ ફંડ્સ 2022
Fund NAV Net Assets (Cr) 3 MO (%) 6 MO (%) 1 YR (%) 3 YR (%) 5 YR (%) 2025 (%) DSP World Gold Fund Growth ₹50.4247
↑ 1.63 ₹1,433 -12.7 -17.8 62.8 43.6 22.1 167.1 SBI Gold Fund Growth ₹41.2688
↓ -0.10 ₹15,294 -5.3 -11.5 42.4 32 22.6 71.5 ICICI Prudential Regular Gold Savings Fund Growth ₹43.6106
↓ -0.07 ₹6,265 -5.3 -13.2 42.2 32 22.5 72 HDFC Gold Fund Growth ₹42.056
↓ -0.09 ₹11,019 -5.2 -11.4 42 31.8 22.4 71.3 Aditya Birla Sun Life Gold Fund Growth ₹40.9668
↓ -0.05 ₹1,648 -5 -13.8 42.1 31.8 22.5 72 Note: Returns up to 1 year are on absolute basis & more than 1 year are on CAGR basis. as on 30 Jul 26 Research Highlights & Commentary of 5 Funds showcased
Commentary DSP World Gold Fund SBI Gold Fund ICICI Prudential Regular Gold Savings Fund HDFC Gold Fund Aditya Birla Sun Life Gold Fund Point 1 Bottom quartile AUM (₹1,433 Cr). Highest AUM (₹15,294 Cr). Lower mid AUM (₹6,265 Cr). Upper mid AUM (₹11,019 Cr). Bottom quartile AUM (₹1,648 Cr). Point 2 Oldest track record among peers (18 yrs). Established history (14+ yrs). Established history (14+ yrs). Established history (14+ yrs). Established history (14+ yrs). Point 3 Top rated. Rating: 2★ (lower mid). Rating: 1★ (bottom quartile). Rating: 1★ (bottom quartile). Rating: 3★ (upper mid). Point 4 Risk profile: High. Risk profile: Moderately High. Risk profile: Moderately High. Risk profile: Moderately High. Risk profile: Moderately High. Point 5 5Y return: 22.15% (bottom quartile). 5Y return: 22.65% (top quartile). 5Y return: 22.46% (lower mid). 5Y return: 22.42% (bottom quartile). 5Y return: 22.48% (upper mid). Point 6 3Y return: 43.62% (top quartile). 3Y return: 32.03% (upper mid). 3Y return: 31.98% (lower mid). 3Y return: 31.79% (bottom quartile). 3Y return: 31.78% (bottom quartile). Point 7 1Y return: 62.77% (top quartile). 1Y return: 42.41% (upper mid). 1Y return: 42.17% (lower mid). 1Y return: 42.00% (bottom quartile). 1Y return: 42.10% (bottom quartile). Point 8 Alpha: 2.12 (top quartile). 1M return: 1.02% (upper mid). 1M return: 0.97% (bottom quartile). 1M return: 1.01% (lower mid). 1M return: 0.98% (bottom quartile). Point 9 Sharpe: 1.22 (bottom quartile). Alpha: 0.00 (upper mid). Alpha: 0.00 (lower mid). Alpha: 0.00 (bottom quartile). Alpha: 0.00 (bottom quartile). Point 10 Information ratio: -0.50 (bottom quartile). Sharpe: 1.29 (top quartile). Sharpe: 1.22 (lower mid). Sharpe: 1.28 (upper mid). Sharpe: 1.20 (bottom quartile). DSP World Gold Fund
SBI Gold Fund
ICICI Prudential Regular Gold Savings Fund
HDFC Gold Fund
Aditya Birla Sun Life Gold Fund
મ્યુચ્યુઅલ ફંડના પ્રકાર: જોખમ અને વળતર
તમે રોકાણ કરો તે પહેલાં, નીચેની મ્યુચ્યુઅલ ફંડ શ્રેણીઓના મૂળભૂત જોખમ અને સરેરાશ વળતર જાણો:
| મ્યુચ્યુઅલ ફંડ કેટેગરી | સરેરાશ વળતર | જોખમ | જોખમનો પ્રકાર |
|---|---|---|---|
| ઇક્વિટી ફંડ્સ | 2%-20% | ઉચ્ચથી મધ્યમ | અસ્થિરતા જોખમ, પ્રદર્શન જોખમ, એકાગ્રતા જોખમ |
| દેવું/બોન્ડ | 8-14% | નીચાથી મધ્યમ | વ્યાજ દર જોખમ, ક્રેડિટ જોખમ |
| મની માર્કેટ ફંડ્સ | 4%-8% | નીચું | ફુગાવો જોખમ, તક ગુમાવવી |
| સંતુલિત ભંડોળ | 5-15% | માધ્યમ | ઇક્વિટી, ડેટ હોલ્ડિંગ્સમાં ઉચ્ચ એક્સપોઝર |
મ્યુચ્યુઅલ ફંડ કેલ્ક્યુલેટર: તમારા રોકાણના વળતર પૂર્વ-નિર્ધારિત કરો
એસિપ કેલ્ક્યુલેટર એ એક સ્માર્ટ સાધન છે જે રોકાણકારોના મુખ્ય પ્રશ્નોનું નિરાકરણ કરે છે જેમ કે 'કેટલું રોકાણ કરવું', 'હું કેટલું કમાઈશ', 'મારો નફો કેટલો હશે', વગેરે.મ્યુચ્યુઅલ ફંડ કેલ્ક્યુલેટર, વધુ વિશિષ્ટ રીતે,SIP કેલ્ક્યુલેટર તમે જે મુદત માટે રોકાણ કરવા માંગો છો તે માટે તમારી રોકાણની રકમ પૂર્વ-નિર્ધારિત કરે છે. તે અસરકારક માટે શ્રેષ્ઠ સાધનો પૈકી એક છેનાણાકીય આયોજન. શું કોઈ વ્યક્તિ કાર, ઘર ખરીદવાની યોજના બનાવવા માંગે છે, તેના માટે યોજના બનાવોનિવૃત્તિ, બાળકનું ઉચ્ચ શિક્ષણ અથવા અન્ય કોઈપણ નાણાકીય ધ્યેય, તેના માટે SIP કેલ્ક્યુલેટરનો ઉપયોગ કરી શકાય છે. કેલ્ક્યુલેટર કેવી રીતે કાર્ય કરે છે તે અહીં છે:
ઉદાહરણ:
માસિક રોકાણ: ₹ 2,000
રોકાણનો સમયગાળો: 10 વર્ષ
રોકાણ કરેલ કુલ રકમ: ₹ 2,40,000
લાંબા ગાળાની ફુગાવો: 5% (આશરે)
લાંબા ગાળાનો વિકાસ દર: 14% (આશરે)
SIP કેલ્ક્યુલેટર મુજબ અપેક્ષિત વળતર: ₹ 4,98,585
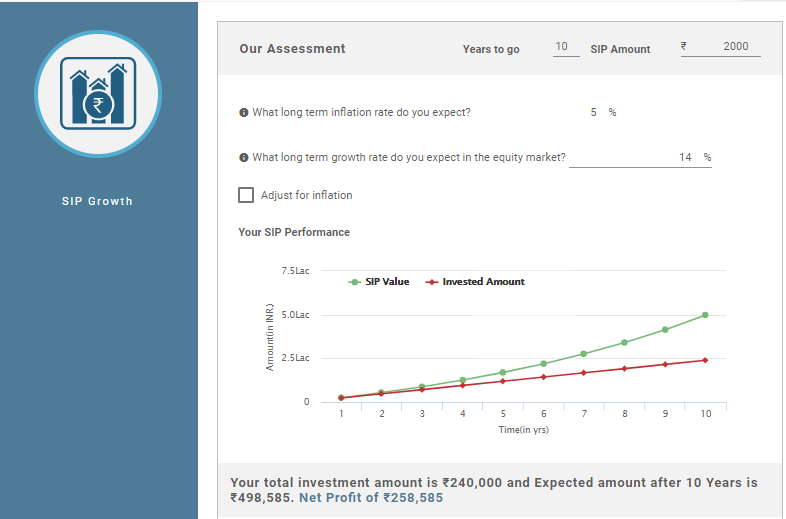
SIP કેલ્ક્યુલેટરમાં તમારે ફક્ત કેટલાક મૂળભૂત ઇનપુટ્સ દાખલ કરવાની જરૂર છે જેમ કે રોકાણની રકમ અને રોકાણનો સમયગાળો (વધારાના ઇનપુટ્સ જેમ કે ફુગાવો અને અપેક્ષિતબજાર વળતર વધુ વાસ્તવિક ચિત્ર આપશે). આ એન્ટ્રીઓનું આઉટપુટ પાકતી મુદતની અંતિમ રકમ અને થયેલ લાભ હશે.
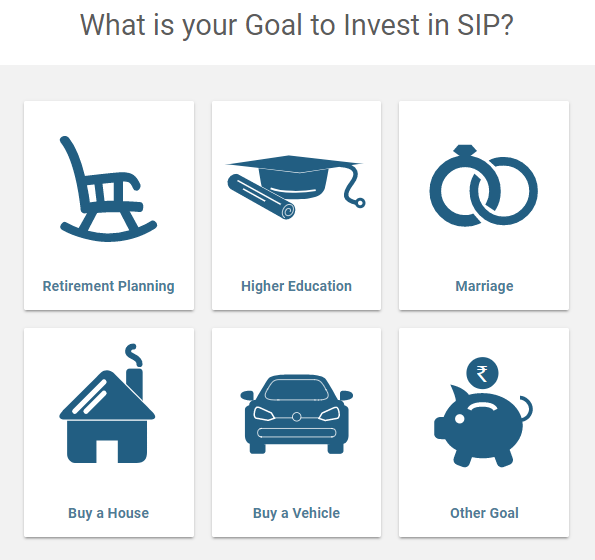
ધ્યેયને ધ્યાનમાં રાખીને સમાન ગણતરી પણ લક્ષ્ય સુધી પહોંચવા માટે વ્યક્તિએ કેટલું રોકાણ કરવું જોઈએ તે નક્કી કરવા માટે કરી શકાય છે. તમારે કોઈ ચોક્કસ ધ્યેય પસંદ કરવો પડશે, જેમ કે નીચે આપેલા છે, અને ધ્યેય કેલ્ક્યુલેટરનો ઉપયોગ કરીને વિગતોનો અંદાજ કાઢવો પડશે.
અહીં આપેલી માહિતી સચોટ છે તેની ખાતરી કરવા માટેના તમામ પ્રયાસો કરવામાં આવ્યા છે. જો કે, ડેટાની શુદ્ધતા અંગે કોઈ ગેરંટી આપવામાં આવતી નથી. કોઈપણ રોકાણ કરતા પહેલા કૃપા કરીને સ્કીમ માહિતી દસ્તાવેજ સાથે ચકાસો.


AMFI Registration No. 112358 | CIN: U74999MH2016PTC282153
Shepard Technologies Pvt. Ltd. (with ARN code 112358) makes no warranties or representations, express or implied, on products offered through the platform. It accepts no liability for any damages or losses, however caused, in connection with the use of, or on the reliance of its product or related services. Terms and conditions of the website are applicable.
©2026 Shepard Technologies Private Limited. All Rights Reserved