SIP 2022 - 2023 کے لیے ہندوستان میں بہترین میوچل فنڈز
ایک منظمسرمایہ کاری کا منصوبہ (گھونٹ) کا سب سے موثر طریقہ سمجھا جاتا ہے۔میوچل فنڈز میں سرمایہ کاری کریں۔خاص طور پر طویل عرصے کے لیےمدتی منصوبہ. یہ سرمایہ کاروں کو طویل مدتی بچت کے منصوبے کو لاگو کرنے کے لیے ہر ماہ ایک مخصوص تاریخ کو یونٹ خریدنے کی اجازت دیتا ہے۔ سرمایہ کاروں کی طرف راحت محسوس کرنے کی ایک وجہسرمایہ کاری SIP میں وہ لچک ہے جو وہ پیش کرتے ہیں۔ سرمایہ کار کر سکتے ہیں۔SIP میں سرمایہ کاری کریں۔ ماہانہ، سہ ماہی یا ہفتہ واربنیاد، ان کی سہولت کے مطابق۔ آئیے اس بارے میں مزید جانیں کہ کوئی ان کو کیسے حاصل کرسکتا ہے۔مالی اہداف منظم سرمایہ کاری کے منصوبوں کے ساتھ، کیسےگھونٹ کیلکولیٹر کے ساتھ ساتھ سرمایہ کاری میں مددگار ہے۔بہترین باہمی فنڈز SIP کے لیے ہندوستان میں۔
SIP- مالی اہداف کے حصول کا بہترین طریقہ
ایس آئی پی کو اس طرح سے ڈیزائن کیا گیا ہے کہ کوئی آسانی سے اپنی سرمایہ کاری کی پہلے سے منصوبہ بندی کر سکتا ہے اور اپنے مالی اہداف کے مطابق سرمایہ کاری کر سکتا ہے۔ لیکن، SIP کے ذریعے اہداف حاصل کرنے کے لیے ایک طویل عرصے تک سرمایہ کاری کرنی پڑتی ہے۔ عام طور پر، SIP بڑے پیمانے پر اہداف کی منصوبہ بندی کے لیے استعمال کیا جاتا ہے جیسے:
Talk to our investment specialist
- کار خریدنا
- گھر خریدنا
- شادی
- بچے کی تعلیم
- بین الاقوامی سفر کے لیے بچت کریں۔
- ریٹائرمنٹ
- طبی ایمرجنسی وغیرہ۔
کوئی بھی کم از کم INR 500 اور INR 1000 کی رقم کے ساتھ SIPs میں سرمایہ کاری شروع کر سکتا ہے۔ ایک بار جب آپ SIP میں سرمایہ کاری کرنا شروع کر دیتے ہیں تو آپ کی رقم ہر روز جانا شروع ہو جاتی ہے کیونکہ یہ اسٹاک کے سامنے آتا ہے۔مارکیٹ. یہی وجہ ہے کہ SIPs کو بطور روٹ زیادہ تر ترجیح دی جاتی ہے۔ایکویٹی فنڈز. مزید برآں، تاریخی طور پر، ایکویٹی اسٹاک میں سرمایہ کاری نے دیگر تمام اثاثوں کے طبقوں کے درمیان متاثر کن منافع دیا ہے، اگر سرمایہ کاری نظم و ضبط کے ساتھ اور طویل مدتی افق کے ساتھ کی گئی ہو۔
ایکویٹی میں ایس آئی پی مارکیٹ کے وقت کے خطرے سے بچنے اور سرمایہ کاری کی اوسط لاگت کے ذریعہ دولت کی تخلیق میں سہولت فراہم کرتا ہے۔ آئیے کچھ اور دیکھتے ہیں۔ایس آئی پی کے فوائد جو طویل مدتی اہداف کے حصول میں مدد کرتا ہے:
کمپاؤنڈنگ کی طاقت- سادہ سود وہ ہے جب آپ صرف اصل پر سود حاصل کرتے ہیں۔ مرکب سود کی صورت میں، سود کی رقم پرنسپل میں شامل کی جاتی ہے، اور سود کا حساب نئے پرنسپل (پرانے پرنسپل کے علاوہ منافع) پر کیا جاتا ہے۔ یہ عمل ہر بار جاری رہتا ہے۔ چونکہ ایس آئی پی میںباہمی چندہ قسطوں میں ہیں، وہ مرکب ہیں، جو ابتدائی طور پر سرمایہ کاری کی رقم میں مزید اضافہ کرتا ہے۔
خطرے میں کمی- یہ دیکھتے ہوئے کہ ایک SIP طویل عرصے تک پھیلا ہوا ہے، کوئی اسٹاک مارکیٹ کے تمام ادوار، اتار چڑھاؤ اور اس سے بھی اہم طور پر مندی کو پکڑتا ہے۔ مندی میں، جب زیادہ تر سرمایہ کاروں کو خوف لاحق ہو جاتا ہے، SIP کی قسطیں اس بات کو یقینی بناتی ہیں کہ سرمایہ کار "کم" خریدیں۔
SIPs کی سہولت- سہولت SIP کے سب سے بڑے فوائد میں سے ایک ہے۔ صارف کو ایک بار سائن اپ کرنا ہوگا اور دستاویزات سے گزرنا ہوگا۔ ایک بار مکمل ہو جانے کے بعد، اس کے بعد کی سرمایہ کاری کے لیے ڈیبٹ خود بخود ہو جاتے ہیں۔سرمایہ کار صرف سرمایہ کاری کی نگرانی کرنا ہے.
SIP 2022 - 2023 کے لیے ہندوستان میں بہترین میوچل فنڈز
ایس آئی پی کے لیے بہترین لارج کیپ فنڈز
Fund NAV Net Assets (Cr) Min SIP Investment 3 MO (%) 6 MO (%) 1 YR (%) 3 YR (%) 5 YR (%) 2024 (%) Invesco India Largecap Fund Growth ₹71.9
↓ -0.13 ₹1,847 100 6.7 4.2 4.8 13.5 11.9 5.5 Bandhan Large Cap Fund Growth ₹78.49
↑ 0.17 ₹2,061 100 4 0.8 1.8 12.5 11.6 8.2 ICICI Prudential Bluechip Fund Growth ₹109.42
↑ 0.39 ₹79,421 100 2.6 -2.1 -0.7 12.2 13.1 11.3 Nippon India Large Cap Fund Growth ₹90.2869
↑ 0.11 ₹53,227 100 1.8 -1 0.1 12.1 14.9 9.2 DSP TOP 100 Equity Growth ₹461.724
↑ 0.93 ₹7,190 500 2.2 -2.7 -2.2 11.6 10.3 8.4 Note: Returns up to 1 year are on absolute basis & more than 1 year are on CAGR basis. as on 30 Jul 26 Research Highlights & Commentary of 5 Funds showcased
Commentary Invesco India Largecap Fund Bandhan Large Cap Fund ICICI Prudential Bluechip Fund Nippon India Large Cap Fund DSP TOP 100 Equity Point 1 Bottom quartile AUM (₹1,847 Cr). Bottom quartile AUM (₹2,061 Cr). Highest AUM (₹79,421 Cr). Upper mid AUM (₹53,227 Cr). Lower mid AUM (₹7,190 Cr). Point 2 Established history (16+ yrs). Established history (20+ yrs). Established history (18+ yrs). Established history (18+ yrs). Oldest track record among peers (23 yrs). Point 3 Rating: 3★ (lower mid). Rating: 2★ (bottom quartile). Top rated. Rating: 4★ (upper mid). Rating: 2★ (bottom quartile). Point 4 Risk profile: Moderately High. Risk profile: Moderately High. Risk profile: Moderately High. Risk profile: Moderately High. Risk profile: Moderately High. Point 5 5Y return: 11.94% (lower mid). 5Y return: 11.59% (bottom quartile). 5Y return: 13.14% (upper mid). 5Y return: 14.89% (top quartile). 5Y return: 10.33% (bottom quartile). Point 6 3Y return: 13.53% (top quartile). 3Y return: 12.49% (upper mid). 3Y return: 12.24% (lower mid). 3Y return: 12.05% (bottom quartile). 3Y return: 11.55% (bottom quartile). Point 7 1Y return: 4.81% (top quartile). 1Y return: 1.79% (upper mid). 1Y return: -0.73% (bottom quartile). 1Y return: 0.06% (lower mid). 1Y return: -2.19% (bottom quartile). Point 8 Alpha: 3.75 (top quartile). Alpha: 2.34 (upper mid). Alpha: -1.21 (bottom quartile). Alpha: 1.07 (lower mid). Alpha: -2.70 (bottom quartile). Point 9 Sharpe: -0.25 (top quartile). Sharpe: -0.35 (upper mid). Sharpe: -0.55 (bottom quartile). Sharpe: -0.43 (lower mid). Sharpe: -0.68 (bottom quartile). Point 10 Information ratio: 0.82 (lower mid). Information ratio: 0.63 (bottom quartile). Information ratio: 0.85 (upper mid). Information ratio: 0.98 (top quartile). Information ratio: 0.53 (bottom quartile). Invesco India Largecap Fund
Bandhan Large Cap Fund
ICICI Prudential Bluechip Fund
Nippon India Large Cap Fund
DSP TOP 100 Equity
ایس آئی پی کے لیے بہترین ملٹی کیپ فنڈز
Fund NAV Net Assets (Cr) Min SIP Investment 3 MO (%) 6 MO (%) 1 YR (%) 3 YR (%) 5 YR (%) 2024 (%) Aditya Birla Sun Life Manufacturing Equity Fund Growth ₹38.13
↑ 0.16 ₹1,229 1,000 8 18.7 19.6 19.7 14.2 3.5 Motilal Oswal Multicap 35 Fund Growth ₹61.2017
↓ -0.37 ₹13,294 500 9.9 6.5 -1.2 18.6 12.3 -5.6 BNP Paribas Multi Cap Fund Growth ₹73.5154
↓ -0.01 ₹588 300 -4.6 -2.6 19.3 17.3 13.6 Mahindra Badhat Yojana Growth ₹38.357
↓ -0.08 ₹6,926 500 6.4 8.7 7.6 16.9 15.3 3.4 ICICI Prudential Multicap Fund Growth ₹851.42
↓ -2.27 ₹18,194 100 4.3 8.8 6.6 16.5 15.1 5.7 Note: Returns up to 1 year are on absolute basis & more than 1 year are on CAGR basis. as on 30 Jul 26 Research Highlights & Commentary of 5 Funds showcased
Commentary Aditya Birla Sun Life Manufacturing Equity Fund Motilal Oswal Multicap 35 Fund BNP Paribas Multi Cap Fund Mahindra Badhat Yojana ICICI Prudential Multicap Fund Point 1 Bottom quartile AUM (₹1,229 Cr). Upper mid AUM (₹13,294 Cr). Bottom quartile AUM (₹588 Cr). Lower mid AUM (₹6,926 Cr). Highest AUM (₹18,194 Cr). Point 2 Established history (11+ yrs). Established history (12+ yrs). Established history (20+ yrs). Established history (9+ yrs). Oldest track record among peers (31 yrs). Point 3 Not Rated. Top rated. Rating: 4★ (upper mid). Not Rated. Rating: 3★ (lower mid). Point 4 Risk profile: High. Risk profile: Moderately High. Risk profile: Moderately High. Risk profile: Moderately High. Risk profile: Moderately High. Point 5 5Y return: 14.20% (lower mid). 5Y return: 12.30% (bottom quartile). 5Y return: 13.57% (bottom quartile). 5Y return: 15.26% (top quartile). 5Y return: 15.11% (upper mid). Point 6 3Y return: 19.70% (top quartile). 3Y return: 18.62% (upper mid). 3Y return: 17.28% (lower mid). 3Y return: 16.88% (bottom quartile). 3Y return: 16.54% (bottom quartile). Point 7 1Y return: 19.64% (top quartile). 1Y return: -1.24% (bottom quartile). 1Y return: 19.34% (upper mid). 1Y return: 7.59% (lower mid). 1Y return: 6.56% (bottom quartile). Point 8 Alpha: 0.00 (lower mid). Alpha: -7.36 (bottom quartile). Alpha: 0.00 (bottom quartile). Alpha: 4.46 (upper mid). Alpha: 6.49 (top quartile). Point 9 Sharpe: 0.54 (upper mid). Sharpe: -0.74 (bottom quartile). Sharpe: 2.86 (top quartile). Sharpe: 0.01 (bottom quartile). Sharpe: 0.09 (lower mid). Point 10 Information ratio: 0.00 (bottom quartile). Information ratio: 0.53 (lower mid). Information ratio: 0.00 (bottom quartile). Information ratio: 0.64 (top quartile). Information ratio: 0.61 (upper mid). Aditya Birla Sun Life Manufacturing Equity Fund
Motilal Oswal Multicap 35 Fund
BNP Paribas Multi Cap Fund
Mahindra Badhat Yojana
ICICI Prudential Multicap Fund
ایس آئی پی کے لیے بہترین مڈ کیپ فنڈز
Fund NAV Net Assets (Cr) Min SIP Investment 3 MO (%) 6 MO (%) 1 YR (%) 3 YR (%) 5 YR (%) 2024 (%) ICICI Prudential MidCap Fund Growth ₹335.27
↓ -1.63 ₹7,846 100 1.8 9.1 11.7 21.9 16.9 11.1 BNP Paribas Mid Cap Fund Growth ₹110.855
↓ -0.42 ₹2,513 300 4 7.5 9.7 17.8 14.6 2.5 Aditya Birla Sun Life Midcap Fund Growth ₹839.11
↓ -6.52 ₹6,624 1,000 5.7 8.7 6.3 16.6 14.3 4.4 TATA Mid Cap Growth Fund Growth ₹461.011
↓ -1.76 ₹5,868 150 4.7 5.9 6.2 16.3 15.1 5.8 Note: Returns up to 1 year are on absolute basis & more than 1 year are on CAGR basis. as on 30 Jul 26 Research Highlights & Commentary of 4 Funds showcased
Commentary ICICI Prudential MidCap Fund BNP Paribas Mid Cap Fund Aditya Birla Sun Life Midcap Fund TATA Mid Cap Growth Fund Point 1 Highest AUM (₹7,846 Cr). Bottom quartile AUM (₹2,513 Cr). Upper mid AUM (₹6,624 Cr). Lower mid AUM (₹5,868 Cr). Point 2 Established history (21+ yrs). Established history (20+ yrs). Established history (23+ yrs). Oldest track record among peers (32 yrs). Point 3 Rating: 2★ (lower mid). Top rated. Rating: 3★ (upper mid). Rating: 2★ (bottom quartile). Point 4 Risk profile: Moderately High. Risk profile: High. Risk profile: Moderately High. Risk profile: Moderately High. Point 5 5Y return: 16.90% (top quartile). 5Y return: 14.65% (lower mid). 5Y return: 14.31% (bottom quartile). 5Y return: 15.09% (upper mid). Point 6 3Y return: 21.86% (top quartile). 3Y return: 17.78% (upper mid). 3Y return: 16.57% (lower mid). 3Y return: 16.31% (bottom quartile). Point 7 1Y return: 11.70% (top quartile). 1Y return: 9.70% (upper mid). 1Y return: 6.27% (lower mid). 1Y return: 6.25% (bottom quartile). Point 8 Alpha: 6.02 (top quartile). Alpha: 3.32 (upper mid). Alpha: -0.17 (lower mid). Alpha: -0.52 (bottom quartile). Point 9 Sharpe: 0.32 (top quartile). Sharpe: 0.22 (upper mid). Sharpe: 0.01 (lower mid). Sharpe: -0.01 (bottom quartile). Point 10 Information ratio: 0.87 (top quartile). Information ratio: -0.21 (upper mid). Information ratio: -0.44 (lower mid). Information ratio: -0.66 (bottom quartile). ICICI Prudential MidCap Fund
BNP Paribas Mid Cap Fund
Aditya Birla Sun Life Midcap Fund
TATA Mid Cap Growth Fund
SIP کے لیے بہترین سمال کیپ فنڈز
Fund NAV Net Assets (Cr) Min SIP Investment 3 MO (%) 6 MO (%) 1 YR (%) 3 YR (%) 5 YR (%) 2024 (%) Sundaram Small Cap Fund Growth ₹284.958
↓ -2.59 ₹3,872 100 6.1 13.6 9.3 17.1 15.9 0.4 IDBI Small Cap Fund Growth ₹33.1192
↓ -0.11 ₹743 500 8.2 19.1 7.6 16.7 16.8 -13.4 DSP Small Cap Fund Growth ₹219.772
↓ -2.15 ₹19,635 500 8.6 18.2 8.8 16.5 16.5 -2.8 Nippon India Small Cap Fund Growth ₹178.759
↓ -0.94 ₹78,407 100 4.9 12.2 4.9 16 18.3 -4.7 Aditya Birla Sun Life Small Cap Fund Growth ₹95.9809
↓ -0.64 ₹5,731 1,000 8 16.7 11.1 15.3 12.3 -3.7 Note: Returns up to 1 year are on absolute basis & more than 1 year are on CAGR basis. as on 30 Jul 26 Research Highlights & Commentary of 5 Funds showcased
Commentary Sundaram Small Cap Fund IDBI Small Cap Fund DSP Small Cap Fund Nippon India Small Cap Fund Aditya Birla Sun Life Small Cap Fund Point 1 Bottom quartile AUM (₹3,872 Cr). Bottom quartile AUM (₹743 Cr). Upper mid AUM (₹19,635 Cr). Highest AUM (₹78,407 Cr). Lower mid AUM (₹5,731 Cr). Point 2 Oldest track record among peers (21 yrs). Established history (9+ yrs). Established history (19+ yrs). Established history (15+ yrs). Established history (19+ yrs). Point 3 Rating: 3★ (bottom quartile). Not Rated. Rating: 4★ (upper mid). Rating: 4★ (lower mid). Top rated. Point 4 Risk profile: Moderately High. Risk profile: Moderately High. Risk profile: Moderately High. Risk profile: Moderately High. Risk profile: Moderately High. Point 5 5Y return: 15.86% (bottom quartile). 5Y return: 16.82% (upper mid). 5Y return: 16.46% (lower mid). 5Y return: 18.27% (top quartile). 5Y return: 12.28% (bottom quartile). Point 6 3Y return: 17.05% (top quartile). 3Y return: 16.70% (upper mid). 3Y return: 16.46% (lower mid). 3Y return: 16.02% (bottom quartile). 3Y return: 15.30% (bottom quartile). Point 7 1Y return: 9.26% (upper mid). 1Y return: 7.58% (bottom quartile). 1Y return: 8.78% (lower mid). 1Y return: 4.86% (bottom quartile). 1Y return: 11.13% (top quartile). Point 8 Alpha: 8.89 (upper mid). Alpha: 9.18 (top quartile). Alpha: 0.00 (bottom quartile). Alpha: 3.21 (lower mid). Alpha: 0.00 (bottom quartile). Point 9 Sharpe: 0.25 (upper mid). Sharpe: 0.27 (top quartile). Sharpe: 0.19 (bottom quartile). Sharpe: 0.02 (bottom quartile). Sharpe: 0.22 (lower mid). Point 10 Information ratio: -0.17 (lower mid). Information ratio: -0.23 (bottom quartile). Information ratio: 0.00 (top quartile). Information ratio: -0.27 (bottom quartile). Information ratio: 0.00 (upper mid). Sundaram Small Cap Fund
IDBI Small Cap Fund
DSP Small Cap Fund
Nippon India Small Cap Fund
Aditya Birla Sun Life Small Cap Fund
بہترین ELSS (ٹیکس سیونگ میوچل فنڈز) SIP کے لیے
Fund NAV Net Assets (Cr) Min SIP Investment 3 MO (%) 6 MO (%) 1 YR (%) 3 YR (%) 5 YR (%) 2024 (%) IDBI Equity Advantage Fund Growth ₹43.39
↑ 0.04 ₹485 500 9.7 15.1 16.9 20.8 10 HDFC Long Term Advantage Fund Growth ₹595.168
↑ 0.28 ₹1,318 500 1.2 15.4 35.5 20.6 17.4 Motilal Oswal Long Term Equity Fund Growth ₹54.0004
↓ -0.58 ₹4,862 500 0.7 11 3 20 16.1 -9.1 Baroda Pioneer ELSS 96 Growth ₹68.6676
↑ 0.33 ₹210 500 -6.1 -3.5 17.6 16.7 11.6 JM Tax Gain Fund Growth ₹51.5311
↑ 0.15 ₹232 500 9.2 8.8 6.9 16 14.7 2.5 Note: Returns up to 1 year are on absolute basis & more than 1 year are on CAGR basis. as on 28 Jul 23 Research Highlights & Commentary of 5 Funds showcased
Commentary IDBI Equity Advantage Fund HDFC Long Term Advantage Fund Motilal Oswal Long Term Equity Fund Baroda Pioneer ELSS 96 JM Tax Gain Fund Point 1 Lower mid AUM (₹485 Cr). Upper mid AUM (₹1,318 Cr). Highest AUM (₹4,862 Cr). Bottom quartile AUM (₹210 Cr). Bottom quartile AUM (₹232 Cr). Point 2 Established history (12+ yrs). Oldest track record among peers (25 yrs). Established history (11+ yrs). Established history (11+ yrs). Established history (18+ yrs). Point 3 Top rated. Rating: 3★ (upper mid). Not Rated. Not Rated. Rating: 3★ (lower mid). Point 4 Risk profile: Moderately High. Risk profile: Moderately High. Risk profile: Moderately High. Risk profile: Moderately High. Risk profile: Moderately High. Point 5 5Y return: 9.97% (bottom quartile). 5Y return: 17.39% (top quartile). 5Y return: 16.06% (upper mid). 5Y return: 11.62% (bottom quartile). 5Y return: 14.69% (lower mid). Point 6 3Y return: 20.84% (top quartile). 3Y return: 20.64% (upper mid). 3Y return: 20.03% (lower mid). 3Y return: 16.70% (bottom quartile). 3Y return: 15.96% (bottom quartile). Point 7 1Y return: 16.92% (lower mid). 1Y return: 35.51% (top quartile). 1Y return: 3.04% (bottom quartile). 1Y return: 17.56% (upper mid). 1Y return: 6.88% (bottom quartile). Point 8 Alpha: 1.78 (bottom quartile). Alpha: 1.75 (bottom quartile). Alpha: 6.27 (top quartile). Alpha: 5.69 (upper mid). Alpha: 4.31 (lower mid). Point 9 Sharpe: 1.21 (lower mid). Sharpe: 2.27 (upper mid). Sharpe: 0.02 (bottom quartile). Sharpe: 2.51 (top quartile). Sharpe: -0.11 (bottom quartile). Point 10 Information ratio: -1.13 (bottom quartile). Information ratio: -0.15 (bottom quartile). Information ratio: 0.76 (top quartile). Information ratio: -0.09 (lower mid). Information ratio: 0.50 (upper mid). IDBI Equity Advantage Fund
HDFC Long Term Advantage Fund
Motilal Oswal Long Term Equity Fund
Baroda Pioneer ELSS 96
JM Tax Gain Fund
SIP کے لیے بہترین سیکٹر فنڈز
Fund NAV Net Assets (Cr) Min SIP Investment 3 MO (%) 6 MO (%) 1 YR (%) 3 YR (%) 5 YR (%) 2024 (%) DSP Natural Resources and New Energy Fund Growth ₹105.999
↑ 0.72 ₹2,401 500 -5.9 -2.6 17.9 19.1 14.8 17.5 BOI AXA Manufacturing and Infrastructure Fund Growth ₹66.44
↓ -0.07 ₹837 1,000 5.8 14.7 16.8 22.8 20.2 7.8 SBI Healthcare Opportunities Fund Growth ₹511.325
↓ -1.27 ₹4,998 500 16.4 26 15.1 22.9 16.9 -3.5 DSP India T.I.G.E.R Fund Growth ₹357.046
↓ -0.11 ₹6,264 500 3.8 15.8 13.7 21.5 21.4 -2.5 UTI Transportation & Logistics Fund Growth ₹297.044
↑ 2.62 ₹3,962 500 9.5 5.3 12.6 18.7 20 19.5 Note: Returns up to 1 year are on absolute basis & more than 1 year are on CAGR basis. as on 29 Jul 26 Research Highlights & Commentary of 5 Funds showcased
Commentary DSP Natural Resources and New Energy Fund BOI AXA Manufacturing and Infrastructure Fund SBI Healthcare Opportunities Fund DSP India T.I.G.E.R Fund UTI Transportation & Logistics Fund Point 1 Bottom quartile AUM (₹2,401 Cr). Bottom quartile AUM (₹837 Cr). Upper mid AUM (₹4,998 Cr). Highest AUM (₹6,264 Cr). Lower mid AUM (₹3,962 Cr). Point 2 Established history (18+ yrs). Established history (16+ yrs). Established history (21+ yrs). Oldest track record among peers (22 yrs). Established history (22+ yrs). Point 3 Top rated. Not Rated. Rating: 2★ (bottom quartile). Rating: 4★ (upper mid). Rating: 3★ (lower mid). Point 4 Risk profile: High. Risk profile: High. Risk profile: High. Risk profile: High. Risk profile: High. Point 5 5Y return: 14.76% (bottom quartile). 5Y return: 20.22% (upper mid). 5Y return: 16.88% (bottom quartile). 5Y return: 21.45% (top quartile). 5Y return: 19.98% (lower mid). Point 6 3Y return: 19.09% (bottom quartile). 3Y return: 22.79% (upper mid). 3Y return: 22.95% (top quartile). 3Y return: 21.50% (lower mid). 3Y return: 18.69% (bottom quartile). Point 7 1Y return: 17.85% (top quartile). 1Y return: 16.83% (upper mid). 1Y return: 15.09% (lower mid). 1Y return: 13.73% (bottom quartile). 1Y return: 12.63% (bottom quartile). Point 8 Alpha: 0.00 (upper mid). Alpha: 0.00 (lower mid). Alpha: 2.23 (top quartile). Alpha: 0.00 (bottom quartile). Alpha: 0.00 (bottom quartile). Point 9 Sharpe: 0.72 (top quartile). Sharpe: 0.53 (lower mid). Sharpe: 0.59 (upper mid). Sharpe: 0.44 (bottom quartile). Sharpe: 0.12 (bottom quartile). Point 10 Information ratio: 0.00 (top quartile). Information ratio: 0.00 (upper mid). Information ratio: -0.17 (bottom quartile). Information ratio: 0.00 (lower mid). Information ratio: 0.00 (bottom quartile). DSP Natural Resources and New Energy Fund
BOI AXA Manufacturing and Infrastructure Fund
SBI Healthcare Opportunities Fund
DSP India T.I.G.E.R Fund
UTI Transportation & Logistics Fund
ایس آئی پی کے لیے بہترین فوکسڈ فنڈز
Fund NAV Net Assets (Cr) Min SIP Investment 3 MO (%) 6 MO (%) 1 YR (%) 3 YR (%) 5 YR (%) 2024 (%) Sundaram Select Focus Fund Growth ₹264.968
↓ -1.18 ₹1,354 100 -5 8.5 24.5 17 17.3 ICICI Prudential Focused Equity Fund Growth ₹95.44
↓ -0.06 ₹17,012 100 5.7 0.7 4 16.8 16.1 15.4 HDFC Focused 30 Fund Growth ₹234.64
↑ 0.48 ₹27,303 300 5.5 0.3 2.7 16 18.3 10.9 SBI Focused Equity Fund Growth ₹394.258
↑ 2.86 ₹47,274 500 3.1 5.4 12.7 15 12.9 15.7 DSP Focus Fund Growth ₹55.495
↑ 0.00 ₹2,601 500 6.2 1.6 1.4 13.8 10.7 7.3 Note: Returns up to 1 year are on absolute basis & more than 1 year are on CAGR basis. as on 24 Dec 21 Research Highlights & Commentary of 5 Funds showcased
Commentary Sundaram Select Focus Fund ICICI Prudential Focused Equity Fund HDFC Focused 30 Fund SBI Focused Equity Fund DSP Focus Fund Point 1 Bottom quartile AUM (₹1,354 Cr). Lower mid AUM (₹17,012 Cr). Upper mid AUM (₹27,303 Cr). Highest AUM (₹47,274 Cr). Bottom quartile AUM (₹2,601 Cr). Point 2 Oldest track record among peers (24 yrs). Established history (17+ yrs). Established history (21+ yrs). Established history (21+ yrs). Established history (16+ yrs). Point 3 Top rated. Rating: 2★ (bottom quartile). Rating: 3★ (upper mid). Rating: 2★ (bottom quartile). Rating: 3★ (lower mid). Point 4 Risk profile: Moderately High. Risk profile: Moderately High. Risk profile: Moderately High. Risk profile: Moderately High. Risk profile: Moderately High. Point 5 5Y return: 17.29% (upper mid). 5Y return: 16.12% (lower mid). 5Y return: 18.35% (top quartile). 5Y return: 12.87% (bottom quartile). 5Y return: 10.73% (bottom quartile). Point 6 3Y return: 17.03% (top quartile). 3Y return: 16.78% (upper mid). 3Y return: 16.01% (lower mid). 3Y return: 14.97% (bottom quartile). 3Y return: 13.82% (bottom quartile). Point 7 1Y return: 24.49% (top quartile). 1Y return: 4.01% (lower mid). 1Y return: 2.72% (bottom quartile). 1Y return: 12.73% (upper mid). 1Y return: 1.42% (bottom quartile). Point 8 Alpha: -5.62 (bottom quartile). Alpha: 2.26 (upper mid). Alpha: -0.27 (bottom quartile). Alpha: 10.04 (top quartile). Alpha: 0.68 (lower mid). Point 9 Sharpe: 1.85 (top quartile). Sharpe: -0.20 (lower mid). Sharpe: -0.32 (bottom quartile). Sharpe: 0.18 (upper mid). Sharpe: -0.27 (bottom quartile). Point 10 Information ratio: -0.52 (bottom quartile). Information ratio: 1.27 (top quartile). Information ratio: 0.67 (upper mid). Information ratio: 0.49 (lower mid). Information ratio: 0.39 (bottom quartile). Sundaram Select Focus Fund
ICICI Prudential Focused Equity Fund
HDFC Focused 30 Fund
SBI Focused Equity Fund
DSP Focus Fund
ایس آئی پی کے لیے بہترین ویلیو فنڈز
Fund NAV Net Assets (Cr) Min SIP Investment 3 MO (%) 6 MO (%) 1 YR (%) 3 YR (%) 5 YR (%) 2024 (%) HDFC Capital Builder Value Fund Growth ₹785.947
↓ -0.49 ₹7,583 300 5.7 4.1 5.9 16 14.6 8.6 Aditya Birla Sun Life Pure Value Fund Growth ₹135.724
↓ -0.55 ₹6,603 1,000 5.4 7.5 9.7 15.8 14.2 2.6 Nippon India Value Fund Growth ₹225.627
↑ 0.32 ₹8,962 100 1.1 -0.4 0.4 15.6 14.7 4.2 ICICI Prudential Value Discovery Fund Growth ₹465.54
↑ 0.68 ₹60,198 100 0.9 -4.1 -0.8 13.7 16 13.8 UTI Value Opportunities Fund Growth ₹167.303
↑ 0.07 ₹9,440 500 2.9 -1.2 -0.3 13.6 12.2 7 Note: Returns up to 1 year are on absolute basis & more than 1 year are on CAGR basis. as on 30 Jul 26 Research Highlights & Commentary of 5 Funds showcased
Commentary HDFC Capital Builder Value Fund Aditya Birla Sun Life Pure Value Fund Nippon India Value Fund ICICI Prudential Value Discovery Fund UTI Value Opportunities Fund Point 1 Bottom quartile AUM (₹7,583 Cr). Bottom quartile AUM (₹6,603 Cr). Lower mid AUM (₹8,962 Cr). Highest AUM (₹60,198 Cr). Upper mid AUM (₹9,440 Cr). Point 2 Oldest track record among peers (32 yrs). Established history (18+ yrs). Established history (21+ yrs). Established history (21+ yrs). Established history (21+ yrs). Point 3 Top rated. Rating: 3★ (upper mid). Not Rated. Rating: 2★ (lower mid). Rating: 1★ (bottom quartile). Point 4 Risk profile: Moderately High. Risk profile: Moderately High. Risk profile: Moderately High. Risk profile: Moderately High. Risk profile: Moderately High. Point 5 5Y return: 14.57% (lower mid). 5Y return: 14.18% (bottom quartile). 5Y return: 14.74% (upper mid). 5Y return: 16.03% (top quartile). 5Y return: 12.22% (bottom quartile). Point 6 3Y return: 16.03% (top quartile). 3Y return: 15.83% (upper mid). 3Y return: 15.56% (lower mid). 3Y return: 13.74% (bottom quartile). 3Y return: 13.64% (bottom quartile). Point 7 1Y return: 5.89% (upper mid). 1Y return: 9.74% (top quartile). 1Y return: 0.40% (lower mid). 1Y return: -0.82% (bottom quartile). 1Y return: -0.34% (bottom quartile). Point 8 Alpha: 3.42 (upper mid). Alpha: 6.28 (top quartile). Alpha: -0.61 (lower mid). Alpha: -3.68 (bottom quartile). Alpha: -3.38 (bottom quartile). Point 9 Sharpe: -0.13 (upper mid). Sharpe: 0.01 (top quartile). Sharpe: -0.36 (lower mid). Sharpe: -0.58 (bottom quartile). Sharpe: -0.53 (bottom quartile). Point 10 Information ratio: 1.47 (top quartile). Information ratio: 0.70 (lower mid). Information ratio: 1.12 (upper mid). Information ratio: 0.38 (bottom quartile). Information ratio: 0.27 (bottom quartile). HDFC Capital Builder Value Fund
Aditya Birla Sun Life Pure Value Fund
Nippon India Value Fund
ICICI Prudential Value Discovery Fund
UTI Value Opportunities Fund
ایس آئی پی کیلکولیٹر
SIP کیلکولیٹر ان موثر ٹولز میں سے ایک ہے جو ایک سرمایہ کار میوچل فنڈز میں سرمایہ کاری کے دوران استعمال کر سکتا ہے۔ چاہے کوئی گاڑی/گھر خریدنے، ریٹائرمنٹ کا منصوبہ، بچے کی اعلیٰ تعلیم یا کوئی اور اثاثہ خریدنے کے لیے سرمایہ کاری کرنا چاہتا ہو، اس کے لیے SIP کیلکولیٹر استعمال کیا جا سکتا ہے۔ یہ سرمایہ کاری کی مقدار اور وقت کی مدت کا حساب لگانے میں مدد کرتا ہے جو مخصوص مالیاتی ہدف تک پہنچنے کے لیے سرمایہ کاری کے لیے درکار ہے۔ لہذا، عام سوالات جیسے "کتنا کرناSIP میں سرمایہ کاری کریں۔ یا اس وقت تک میں کیسے سرمایہ کاری کروں"، اس کیلکولیٹر کا استعمال کرتے ہوئے حل کرتا ہے۔
ایس آئی پی کیلکولیٹر کا استعمال کرتے وقت، کسی کو کچھ متغیرات کو پُر کرنا پڑتا ہے، جن میں شامل ہیں (مثال ذیل میں دی گئی ہے)-
- مطلوبہ سرمایہ کاری کی مدت
- تخمینہ شدہ ماہانہ SIP رقم
- متوقعمہنگائی آنے والے سالوں کے لیے شرح (سالانہ)
- سرمایہ کاری پر طویل مدتی ترقی کی شرح
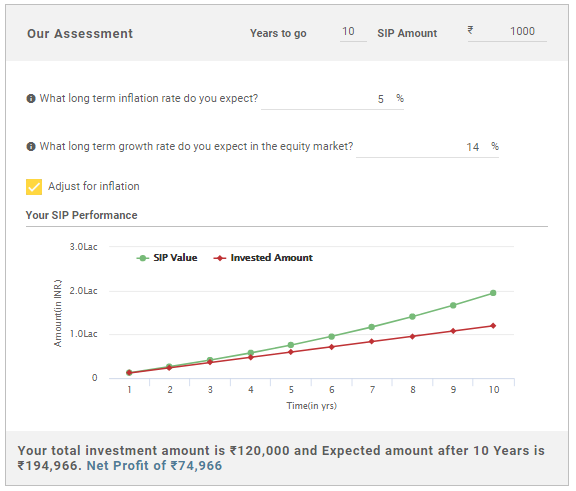
ایک بار جب آپ اوپر دی گئی تمام معلومات کو فیڈ کر دیں گے، تو کیلکولیٹر آپ کو وہ رقم دے گا جو آپ کو سال کی تعداد کے بعد موصول ہو گی (آپ کی ایس آئی پی کی واپسی)۔ آپ کے خالص منافع کو بھی نمایاں کیا جائے گا تاکہ آپ اس کے مطابق اپنے ہدف کی تکمیل کا اندازہ لگا سکیں۔
بہترین میوچل فنڈز میں کیسے سرمایہ کاری کی جائے؟
Fincash.com پر لائف ٹائم کے لیے مفت انویسٹمنٹ اکاؤنٹ کھولیں۔
اپنی رجسٹریشن اور KYC کا عمل مکمل کریں۔
دستاویزات اپ لوڈ کریں (PAN، آدھار، وغیرہ)۔اور، آپ سرمایہ کاری کے لیے تیار ہیں!
یہاں فراہم کردہ معلومات کے درست ہونے کو یقینی بنانے کے لیے تمام کوششیں کی گئی ہیں۔ تاہم، ڈیٹا کی درستگی کے حوالے سے کوئی ضمانت نہیں دی جاتی ہے۔ براہ کرم کوئی بھی سرمایہ کاری کرنے سے پہلے اسکیم کی معلومات کے دستاویز کے ساتھ تصدیق کریں۔


AMFI Registration No. 112358 | CIN: U74999MH2016PTC282153
Shepard Technologies Pvt. Ltd. (with ARN code 112358) makes no warranties or representations, express or implied, on products offered through the platform. It accepts no liability for any damages or losses, however caused, in connection with the use of, or on the reliance of its product or related services. Terms and conditions of the website are applicable.
©2026 Shepard Technologies Private Limited. All Rights Reserved