SIP 2022 کے لیے 11 بہترین میوچل فنڈز
گھونٹ باہمی چندہ (یا ٹاپ 11 SIP میوچل فنڈز) وہ فنڈز ہیں جو اسٹاک مارکیٹ کے ناگزیر اتار چڑھاؤ کے دوران اعصابی فروخت سے بچنے کے لیے متواتر سرمایہ کاری کے سادہ فارمولے پر عمل پیرا ہوتے ہیں۔
عام طور پر، SIP یا منظمسرمایہ کاری کا منصوبہ میوچل فنڈز میں پیسہ لگانے کا ایک طریقہ ہے۔سرمایہ کاری سرفہرست 11 ایس آئی پی میوچل فنڈز میں آپ کی سرمایہ کاری کے لیے ایک منظم اور نظم و ضبط کا طریقہ ہے۔ یہ روزانہ آپ کی سرمایہ کاری کا انتظام کرنے کی آپ کی کوششوں کو کم کرتا ہے۔بنیاد. مزید یہ کہ یہ اس کا فائدہ اٹھاتا ہے۔کمپاؤنڈنگ کی طاقت وقت کے ساتھ مطلوبہ واپسی کا باعث بنتا ہے۔

مختلف ہیں۔میوچل فنڈز کی اقسام ایس آئی پی کے لیے جس میں ایکویٹی، قرض، متوازن، انتہائیمختصر مدت کے فنڈزتاہم، ایکویٹی میوچل فنڈز SIP کے ذریعے سرمایہ کاری کرنے پر زیادہ سے زیادہ منافع پیش کرتے ہیں۔ مالیاتی مشیر مشورہ دیتے ہیں کہ، سرمایہ کاروں کو سرمایہ کاری کرنی چاہیے۔بہترین باہمی فنڈز SIP کی بنیاد پر ان کی سرمایہ کاری کے مقاصد اور مدتSIP سرمایہ کاری.
ٹاپ 11 SIP فنڈز میں کیوں سرمایہ کاری کریں؟
ایس آئی پیز میوچل فنڈز میں سرمایہ کاری کے لیے ایک نظم و ضبط کا طریقہ فراہم کرتے ہیں۔
منظم سرمایہ کاری مستقبل کے خواب اور بڑے اہداف جیسے ریٹائرمنٹ، بچوں کا کیریئر، مکان، کار یا کسی دوسرے اثاثے کی خریداری میں مدد کرتی ہے۔
SIPs زیادہ سے زیادہ مرکب سازی کرنے میں مدد کرتے ہیں اور نوجوان سرمایہ کاروں کے لیے مثالی ہیں۔
منظم سرمایہ کاری کے منصوبے ایکویٹی کے اتار چڑھاو کے خطرے کو کم کرتے ہیں۔
SIP میں سرمایہ کاری کیسے کی جائے؟
پیسہ لگانا ایک فن ہے، اگر صحیح طریقے سے کیا جائے تو یہ حیرت انگیز کام کر سکتا ہے۔ اب جب کہ آپ جانتے ہیں۔ٹاپ ایس آئی پی آپ کو اس میں سرمایہ کاری کرنے کا طریقہ معلوم ہونا چاہیے۔ ہم نے ذیل میں SIP میں سرمایہ کاری کرنے کے اقدامات کا ذکر کیا ہے۔
1. اپنے مالی اہداف کا تجزیہ کریں۔
ایک SIP سرمایہ کاری کا انتخاب کریں جو آپ کے مطابق ہو۔مالی اہداف. مثال کے طور پر، اگر آپ کا مقصد قلیل مدتی ہے (اگر آپ اگلے 2 سالوں میں کار خریدنا چاہتے ہیں)، تو آپ کو ڈیبٹ میوچل فنڈز میں سرمایہ کاری کرنی چاہیے۔ اور، اگر آپ کا مقصد طویل مدتی ہے (جیسےریٹائرمنٹ پلاننگ) پھر ایکویٹی میوچل فنڈز میں سرمایہ کاری کو ترجیح دیں۔
2. سرمایہ کاری کی ٹائم لائن منتخب کریں۔
یہ یقینی بنائے گا کہ آپ صحیح وقت کے لیے صحیح رقم کی سرمایہ کاری کرتے ہیں۔
3. اس رقم کا فیصلہ کریں جو آپ ماہانہ سرمایہ کاری کرنا چاہتے ہیں۔
چونکہ ایس آئی پی ایک ماہانہ سرمایہ کاری ہے، آپ کو ایسی رقم کا انتخاب کرنا چاہیے جس کے بغیر آپ ماہانہ سرمایہ کاری کر سکیں گے۔ناکام. آپ استعمال کرتے ہوئے اپنے مقصد کے مطابق مناسب رقم کا حساب بھی لگا سکتے ہیں۔گھونٹ کیلکولیٹر یا SIP ریٹرن کیلکولیٹر۔
4. بہترین SIP پلان منتخب کریں۔
مشورہ کرکے سرمایہ کاری کا دانشمندانہ انتخاب کریں۔مشیر خزانہ یا منتخب کر کےبہترین SIP پلانز مختلف آن لائن سرمایہ کاری پلیٹ فارمز کی طرف سے پیش کردہ۔
Talk to our investment specialist
ہندوستان میں FY 22 - 23 میں سرفہرست 11 SIP میوچل فنڈز
To generate capital appreciation and income distribution to unit holders by investing predominantly in equity/equity related securities of the companies belonging to the infrastructure development and balance in debt securities and money market instruments. Below is the key information for ICICI Prudential Infrastructure Fund Returns up to 1 year are on The objective of the scheme would be to provide investors with opportunities for long-term growth in capital along with the liquidity of an open-ended scheme through an active management of investments in a diversified basket of equity stocks of domestic Public Sector Undertakings and in debt and money market instruments issued by PSUs AND others. Research Highlights for SBI PSU Fund Below is the key information for SBI PSU Fund Returns up to 1 year are on The investment objective of the scheme is to provide long term growth from a portfolio of equity / equity related instruments of companies engaged either directly or indirectly in the infrastructure sector. Research Highlights for LIC MF Infrastructure Fund Below is the key information for LIC MF Infrastructure Fund Returns up to 1 year are on "The primary investment objective of the Scheme is to seek capital appreciation by investing predominantly in units of MLIIF - WGF. The Scheme may, at the discretion of the Investment Manager, also invest in the units of other similar overseas mutual fund schemes, which may constitute a significant part of its corpus. The Scheme may also invest a certain portion of its corpus in money market securities and/or units of money market/liquid schemes of DSP Merrill Lynch Mutual Fund, in order to meet liquidity requirements from time to time. However, there is no assurance that the investment objective of the Scheme will be realized." Research Highlights for DSP World Gold Fund Below is the key information for DSP World Gold Fund Returns up to 1 year are on (Erstwhile Reliance Diversified Power Sector Fund) The primary investment objective of the scheme is to generate long term capital appreciation by investing predominantly in equity and equity related securities of companies in the power sector. Research Highlights for Nippon India Power and Infra Fund Below is the key information for Nippon India Power and Infra Fund Returns up to 1 year are on To generate capital appreciation, from a portfolio that is substantially constituted of equity securities and equity related securities of corporates, which could benefit from structural changes brought about by continuing liberalization in economic policies by the government and/or continuing investments in infrastructure, both by the public and private sector. Research Highlights for DSP India T.I.G.E.R Fund Below is the key information for DSP India T.I.G.E.R Fund Returns up to 1 year are on To generate capital appreciation by investing in Equity and Equity Related Instruments of companies where the Central / State Government(s) has majority shareholding or management control or has powers to appoint majority of directors. However, there is no assurance or guarantee that the investment objective of the Scheme will be achieved. The Scheme does not assure or guarantee any returns. Research Highlights for Invesco India PSU Equity Fund Below is the key information for Invesco India PSU Equity Fund Returns up to 1 year are on The Scheme seeks to generate long term capital appreciation through a portfolio of predominantly equity and equity related securities of companies engaged in manufacturing and infrastructure and related sectors. Further, there can be no assurance that the investment objectives of the scheme will be realized. The Scheme is not providing any assured or guaranteed returns Research Highlights for BOI AXA Manufacturing and Infrastructure Fund Below is the key information for BOI AXA Manufacturing and Infrastructure Fund Returns up to 1 year are on Investment Objective is “capital appreciation” through investments in stocks of the companies engaged in the transportation and logistics sector. Research Highlights for UTI Transportation & Logistics Fund Below is the key information for UTI Transportation & Logistics Fund Returns up to 1 year are on T o g e n e r a t e income/capital appreciation by investing in equities and equity related instruments of companies in the infrastructure sector. However, there can be no assurance that the investment objective of the scheme will be realized. Research Highlights for Canara Robeco Infrastructure Below is the key information for Canara Robeco Infrastructure Returns up to 1 year are on The Scheme seeks to achieve capital appreciation by investing in companies engaged directly or indirectly in infrastructure related activities. Research Highlights for Franklin Build India Fund Below is the key information for Franklin Build India Fund Returns up to 1 year are on Fund NAV Net Assets (Cr) Min SIP Investment 3 MO (%) 6 MO (%) 1 YR (%) 3 YR (%) 5 YR (%) 2025 (%) ICICI Prudential Infrastructure Fund Growth ₹202.51
↑ 0.83 ₹8,550 100 1.1 5.4 4.6 18.4 23 6.7 SBI PSU Fund Growth ₹34.3228
↑ 0.27 ₹6,684 500 -4.4 -1.7 9.6 22.4 22.9 11.3 LIC MF Infrastructure Fund Growth ₹54.5662
↑ 0.75 ₹1,137 1,000 5.3 14.5 9.8 24.5 22.4 -3.7 DSP World Gold Fund Growth ₹50.4247
↑ 1.63 ₹1,433 500 -12.7 -17.8 62.8 43.6 22.1 167.1 Nippon India Power and Infra Fund Growth ₹381.086
↑ 3.66 ₹8,043 100 0.6 14 11.4 19.9 22 -0.5 DSP India T.I.G.E.R Fund Growth ₹359.538
↑ 2.49 ₹6,264 500 4.5 16.6 15.1 21.2 21.6 -2.5 Invesco India PSU Equity Fund Growth ₹64.91
↑ 0.49 ₹1,473 500 -3.5 -5.1 4.4 20 20.6 10.3 BOI AXA Manufacturing and Infrastructure Fund Growth ₹66.6
↑ 0.16 ₹837 1,000 6.1 15 17.9 22.3 20.3 7.8 UTI Transportation & Logistics Fund Growth ₹300.36
↑ 3.32 ₹3,962 500 10.7 6.5 14 18.7 20.3 19.5 Canara Robeco Infrastructure Growth ₹168.33
↑ 1.38 ₹998 1,000 -1.6 7.9 4.9 19.4 19.8 0.1 Franklin Build India Fund Growth ₹144.394
↑ 0.99 ₹3,256 500 -2 1.9 1.9 18.1 19.7 3.7 Note: Returns up to 1 year are on absolute basis & more than 1 year are on CAGR basis. as on 31 Jul 26 Research Highlights & Commentary of 11 Funds showcased
Commentary ICICI Prudential Infrastructure Fund SBI PSU Fund LIC MF Infrastructure Fund DSP World Gold Fund Nippon India Power and Infra Fund DSP India T.I.G.E.R Fund Invesco India PSU Equity Fund BOI AXA Manufacturing and Infrastructure Fund UTI Transportation & Logistics Fund Canara Robeco Infrastructure Franklin Build India Fund Point 1 Highest AUM (₹8,550 Cr). Upper mid AUM (₹6,684 Cr). Bottom quartile AUM (₹1,137 Cr). Lower mid AUM (₹1,433 Cr). Top quartile AUM (₹8,043 Cr). Upper mid AUM (₹6,264 Cr). Lower mid AUM (₹1,473 Cr). Bottom quartile AUM (₹837 Cr). Upper mid AUM (₹3,962 Cr). Bottom quartile AUM (₹998 Cr). Lower mid AUM (₹3,256 Cr). Point 2 Established history (20+ yrs). Established history (16+ yrs). Established history (18+ yrs). Established history (18+ yrs). Established history (22+ yrs). Oldest track record among peers (22 yrs). Established history (16+ yrs). Established history (16+ yrs). Established history (22+ yrs). Established history (20+ yrs). Established history (16+ yrs). Point 3 Rating: 3★ (lower mid). Rating: 2★ (lower mid). Not Rated. Rating: 3★ (upper mid). Rating: 4★ (upper mid). Rating: 4★ (top quartile). Rating: 3★ (upper mid). Not Rated. Rating: 3★ (lower mid). Not Rated. Top rated. Point 4 Risk profile: High. Risk profile: High. Risk profile: High. Risk profile: High. Risk profile: High. Risk profile: High. Risk profile: High. Risk profile: High. Risk profile: High. Risk profile: High. Risk profile: High. Point 5 5Y return: 22.96% (top quartile). 5Y return: 22.88% (top quartile). 5Y return: 22.40% (upper mid). 5Y return: 22.15% (upper mid). 5Y return: 21.98% (upper mid). 5Y return: 21.62% (lower mid). 5Y return: 20.63% (lower mid). 5Y return: 20.28% (lower mid). 5Y return: 20.25% (bottom quartile). 5Y return: 19.82% (bottom quartile). 5Y return: 19.68% (bottom quartile). Point 6 3Y return: 18.40% (bottom quartile). 3Y return: 22.37% (upper mid). 3Y return: 24.50% (top quartile). 3Y return: 43.62% (top quartile). 3Y return: 19.91% (lower mid). 3Y return: 21.24% (upper mid). 3Y return: 20.01% (lower mid). 3Y return: 22.25% (upper mid). 3Y return: 18.66% (bottom quartile). 3Y return: 19.44% (lower mid). 3Y return: 18.05% (bottom quartile). Point 7 1Y return: 4.59% (bottom quartile). 1Y return: 9.60% (lower mid). 1Y return: 9.79% (lower mid). 1Y return: 62.77% (top quartile). 1Y return: 11.37% (upper mid). 1Y return: 15.10% (upper mid). 1Y return: 4.39% (bottom quartile). 1Y return: 17.88% (top quartile). 1Y return: 14.00% (upper mid). 1Y return: 4.86% (lower mid). 1Y return: 1.90% (bottom quartile). Point 8 Alpha: 0.00 (upper mid). Alpha: -0.30 (bottom quartile). Alpha: 8.41 (top quartile). Alpha: 2.12 (upper mid). Alpha: 8.81 (top quartile). Alpha: 0.00 (upper mid). Alpha: -6.88 (bottom quartile). Alpha: 0.00 (lower mid). Alpha: 0.00 (lower mid). Alpha: 0.00 (lower mid). Alpha: 0.00 (bottom quartile). Point 9 Sharpe: -0.07 (bottom quartile). Sharpe: 0.12 (lower mid). Sharpe: 0.22 (upper mid). Sharpe: 1.22 (top quartile). Sharpe: 0.24 (upper mid). Sharpe: 0.44 (upper mid). Sharpe: -0.16 (bottom quartile). Sharpe: 0.53 (top quartile). Sharpe: 0.12 (lower mid). Sharpe: 0.02 (lower mid). Sharpe: -0.04 (bottom quartile). Point 10 Information ratio: 0.00 (upper mid). Information ratio: -0.11 (bottom quartile). Information ratio: 0.58 (top quartile). Information ratio: -0.50 (bottom quartile). Information ratio: 0.56 (top quartile). Information ratio: 0.00 (upper mid). Information ratio: -0.57 (bottom quartile). Information ratio: 0.00 (lower mid). Information ratio: 0.00 (lower mid). Information ratio: 0.00 (upper mid). Information ratio: 0.00 (lower mid). ICICI Prudential Infrastructure Fund
SBI PSU Fund
LIC MF Infrastructure Fund
DSP World Gold Fund
Nippon India Power and Infra Fund
DSP India T.I.G.E.R Fund
Invesco India PSU Equity Fund
BOI AXA Manufacturing and Infrastructure Fund
UTI Transportation & Logistics Fund
Canara Robeco Infrastructure
Franklin Build India Fund
200 کروڑ میوچل فنڈز کی ایکویٹی کیٹیگری میں 5 سالہ کیلنڈر سال کے ریٹرن کی بنیاد پر آرڈر کیا گیا ہے۔1. ICICI Prudential Infrastructure Fund
ICICI Prudential Infrastructure Fund
Growth Launch Date 31 Aug 05 NAV (31 Jul 26) ₹202.51 ↑ 0.83 (0.41 %) Net Assets (Cr) ₹8,550 on 30 Jun 26 Category Equity - Sectoral AMC ICICI Prudential Asset Management Company Limited Rating ☆☆☆ Risk High Expense Ratio 1.89 Sharpe Ratio -0.07 Information Ratio 0 Alpha Ratio 0 Min Investment 5,000 Min SIP Investment 100 Exit Load 0-1 Years (1%),1 Years and above(NIL) Growth of 10,000 investment over the years.
Date Value 31 Jul 21 ₹10,000 31 Jul 22 ₹11,961 31 Jul 23 ₹16,935 31 Jul 24 ₹27,533 31 Jul 25 ₹26,878 31 Jul 26 ₹28,111 Returns for ICICI Prudential Infrastructure Fund
absolute basis & more than 1 year are on CAGR (Compound Annual Growth Rate) basis. as on 31 Jul 26 Duration Returns 1 Month -0.8% 3 Month 1.1% 6 Month 5.4% 1 Year 4.6% 3 Year 18.4% 5 Year 23% 10 Year 15 Year Since launch 15.5% Historical performance (Yearly) on absolute basis
Year Returns 2025 6.7% 2024 27.4% 2023 44.6% 2022 28.8% 2021 50.1% 2020 3.6% 2019 2.6% 2018 -14% 2017 40.8% 2016 2% Fund Manager information for ICICI Prudential Infrastructure Fund
Name Since Tenure Ihab Dalwai 3 Jun 17 9.08 Yr. Sharmila D’mello 30 Jun 22 4.01 Yr. Data below for ICICI Prudential Infrastructure Fund as on 30 Jun 26
Equity Sector Allocation
Sector Value Industrials 47.57% Financial Services 10.57% Utility 10.32% Basic Materials 9.74% Real Estate 8.09% Energy 5.04% Consumer Cyclical 1.98% Communication Services 0.09% Asset Allocation
Asset Class Value Cash 5.83% Equity 94.17% Top Securities Holdings / Portfolio
Name Holding Value Quantity InterGlobe Aviation Ltd (Industrials)
Equity, Since 28 Feb 23 | INDIGO9% ₹745 Cr 1,691,985
↑ 50,000 Larsen & Toubro Ltd (Industrials)
Equity, Since 30 Nov 09 | LT7% ₹614 Cr 1,505,704 Oberoi Realty Ltd (Real Estate)
Equity, Since 31 May 23 | OBEROIRLTY4% ₹365 Cr 2,139,426 Gujarat Energy Ltd (Utilities)
Equity, Since 31 Jan 23 | GUJGASLTD4% ₹340 Cr 8,482,024
↑ 156,557 NTPC Ltd (Utilities)
Equity, Since 29 Feb 16 | NTPC4% ₹334 Cr 8,626,448 Shree Cement Ltd (Basic Materials)
Equity, Since 30 Apr 24 | SHREECEM3% ₹270 Cr 106,892
↑ 3,387 Kalpataru Projects International Ltd (Industrials)
Equity, Since 30 Sep 06 | KPIL3% ₹262 Cr 2,005,608 AIA Engineering Ltd (Industrials)
Equity, Since 28 Feb 21 | AIAENG3% ₹258 Cr 572,697 HDFC Bank Ltd (Financial Services)
Equity, Since 31 Jan 22 | HDFCBANK3% ₹250 Cr 3,357,506
↑ 1,057,506 Container Corporation of India Ltd (Industrials)
Equity, Since 31 Jan 16 | CONCOR3% ₹227 Cr 4,885,153 2. SBI PSU Fund
SBI PSU Fund
Growth Launch Date 7 Jul 10 NAV (31 Jul 26) ₹34.3228 ↑ 0.27 (0.79 %) Net Assets (Cr) ₹6,684 on 30 Jun 26 Category Equity - Sectoral AMC SBI Funds Management Private Limited Rating ☆☆ Risk High Expense Ratio 1.89 Sharpe Ratio 0.12 Information Ratio -0.11 Alpha Ratio -0.3 Min Investment 5,000 Min SIP Investment 500 Exit Load 0-1 Years (1%),1 Years and above(NIL) Growth of 10,000 investment over the years.
Date Value 31 Jul 21 ₹10,000 31 Jul 22 ₹10,878 31 Jul 23 ₹15,287 31 Jul 24 ₹28,684 31 Jul 25 ₹25,557 31 Jul 26 ₹28,011 Returns for SBI PSU Fund
absolute basis & more than 1 year are on CAGR (Compound Annual Growth Rate) basis. as on 31 Jul 26 Duration Returns 1 Month -0.8% 3 Month -4.4% 6 Month -1.7% 1 Year 9.6% 3 Year 22.4% 5 Year 22.9% 10 Year 15 Year Since launch 8% Historical performance (Yearly) on absolute basis
Year Returns 2025 11.3% 2024 23.5% 2023 54% 2022 29% 2021 32.4% 2020 -10% 2019 6% 2018 -23.8% 2017 21.9% 2016 16.2% Fund Manager information for SBI PSU Fund
Name Since Tenure Rohit Shimpi 1 Jun 24 2.08 Yr. Data below for SBI PSU Fund as on 30 Jun 26
Equity Sector Allocation
Sector Value Financial Services 32.54% Utility 31.22% Industrials 14.07% Energy 11.97% Basic Materials 6.94% Asset Allocation
Asset Class Value Cash 3.18% Equity 96.74% Debt 0.07% Top Securities Holdings / Portfolio
Name Holding Value Quantity State Bank of India (Financial Services)
Equity, Since 31 Jul 10 | SBIN17% ₹1,112 Cr 11,527,500
↑ 1,000,000 GAIL (India) Ltd (Utilities)
Equity, Since 31 May 24 | GAIL10% ₹628 Cr 38,150,000 NTPC Ltd (Utilities)
Equity, Since 31 Jul 10 | NTPC9% ₹597 Cr 15,443,244 Bharat Electronics Ltd (Industrials)
Equity, Since 30 Jun 24 | BEL9% ₹583 Cr 14,185,000
↑ 800,000 Power Grid Corp Of India Ltd (Utilities)
Equity, Since 31 Jul 10 | POWERGRID9% ₹579 Cr 19,935,554 Oil & Natural Gas Corp Ltd (Energy)
Equity, Since 31 May 20 | ONGC6% ₹389 Cr 14,655,000 Bank of Baroda (Financial Services)
Equity, Since 31 Aug 24 | BANKBARODA5% ₹352 Cr 13,100,000 Bharat Petroleum Corp Ltd (Energy)
Equity, Since 31 Aug 24 | BPCL4% ₹289 Cr 9,700,000 Bharat Heavy Electricals Ltd (Industrials)
Equity, Since 30 Jun 25 | BHEL4% ₹271 Cr 6,500,000 NMDC Ltd (Basic Materials)
Equity, Since 31 Oct 23 | NMDC4% ₹245 Cr 27,900,000 3. LIC MF Infrastructure Fund
LIC MF Infrastructure Fund
Growth Launch Date 29 Feb 08 NAV (31 Jul 26) ₹54.5662 ↑ 0.75 (1.39 %) Net Assets (Cr) ₹1,137 on 30 Jun 26 Category Equity - Sectoral AMC LIC Mutual Fund Asset Mgmt Co Ltd Rating Risk High Expense Ratio 2.21 Sharpe Ratio 0.22 Information Ratio 0.58 Alpha Ratio 8.41 Min Investment 5,000 Min SIP Investment 1,000 Exit Load 0-1 Years (1%),1 Years and above(NIL) Growth of 10,000 investment over the years.
Date Value 31 Jul 21 ₹10,000 31 Jul 22 ₹11,519 31 Jul 23 ₹14,236 31 Jul 24 ₹26,350 31 Jul 25 ₹25,021 31 Jul 26 ₹27,470 Returns for LIC MF Infrastructure Fund
absolute basis & more than 1 year are on CAGR (Compound Annual Growth Rate) basis. as on 31 Jul 26 Duration Returns 1 Month -0.9% 3 Month 5.3% 6 Month 14.5% 1 Year 9.8% 3 Year 24.5% 5 Year 22.4% 10 Year 15 Year Since launch 9.7% Historical performance (Yearly) on absolute basis
Year Returns 2025 -3.7% 2024 47.8% 2023 44.4% 2022 7.9% 2021 46.6% 2020 -0.1% 2019 13.3% 2018 -14.6% 2017 42.2% 2016 -2.2% Fund Manager information for LIC MF Infrastructure Fund
Name Since Tenure Sumit Bhatnagar 7 Apr 26 0.23 Yr. Mahesh Bendre 1 Jul 24 2 Yr. Data below for LIC MF Infrastructure Fund as on 30 Jun 26
Equity Sector Allocation
Sector Value Industrials 37.05% Consumer Cyclical 20.88% Basic Materials 12.42% Utility 11.88% Communication Services 5.02% Financial Services 3.98% Real Estate 1.97% Health Care 1.89% Technology 1.08% Asset Allocation
Asset Class Value Cash 3.82% Equity 96.18% Top Securities Holdings / Portfolio
Name Holding Value Quantity Larsen & Toubro Ltd (Industrials)
Equity, Since 30 Apr 09 | LT4% ₹44 Cr 106,968
↓ -10,884 Garware Hi-Tech Films Ltd (Basic Materials)
Equity, Since 31 Aug 23 | 5006554% ₹40 Cr 65,325
↓ -7,684 Tata Motors Passenger Vehicles Ltd (Consumer Cyclical)
Equity, Since 28 Feb 26 | TMPV4% ₹39 Cr 982,891
↓ -332,760 Tata Motors Ltd (Consumer Cyclical)
Equity, Since 31 Oct 25 | TMCV4% ₹39 Cr 1,015,933
↑ 26,983 Tata Power Co Ltd (Utilities)
Equity, Since 29 Feb 24 | TATAPOWER3% ₹36 Cr 861,040
↑ 524,312 KSH International Ltd (Industrials)
Equity, Since 31 Dec 25 | KSHINTL3% ₹34 Cr 432,816
↑ 6,280 Siemens Energy India Ltd (Utilities)
Equity, Since 31 Aug 25 | ENRIN3% ₹34 Cr 87,106
↑ 24,800 JSW Infrastructure Ltd (Industrials)
Equity, Since 30 Apr 26 | JSWINFRA3% ₹31 Cr 1,133,858
↑ 745,681 Carraro India Ltd (Consumer Cyclical)
Equity, Since 31 Dec 24 | CARRARO3% ₹31 Cr 572,991 Bharat Dynamics Ltd Ordinary Shares (Industrials)
Equity, Since 31 Jan 26 | BDL3% ₹29 Cr 242,954
↑ 157,744 4. DSP World Gold Fund
DSP World Gold Fund
Growth Launch Date 14 Sep 07 NAV (30 Jul 26) ₹50.4247 ↑ 1.63 (3.33 %) Net Assets (Cr) ₹1,433 on 30 Jun 26 Category Equity - Global AMC DSP BlackRock Invmt Managers Pvt. Ltd. Rating ☆☆☆ Risk High Expense Ratio 1.41 Sharpe Ratio 1.22 Information Ratio -0.5 Alpha Ratio 2.12 Min Investment 1,000 Min SIP Investment 500 Exit Load 0-12 Months (1%),12 Months and above(NIL) Growth of 10,000 investment over the years.
Date Value 31 Jul 21 ₹10,000 31 Jul 22 ₹7,373 31 Jul 23 ₹9,366 31 Jul 24 ₹11,150 31 Jul 25 ₹16,504 31 Jul 26 ₹26,355 Returns for DSP World Gold Fund
absolute basis & more than 1 year are on CAGR (Compound Annual Growth Rate) basis. as on 31 Jul 26 Duration Returns 1 Month 2.3% 3 Month -12.7% 6 Month -17.8% 1 Year 62.8% 3 Year 43.6% 5 Year 22.1% 10 Year 15 Year Since launch 8.9% Historical performance (Yearly) on absolute basis
Year Returns 2025 167.1% 2024 15.9% 2023 7% 2022 -7.7% 2021 -9% 2020 31.4% 2019 35.1% 2018 -10.7% 2017 -4% 2016 52.7% Fund Manager information for DSP World Gold Fund
Name Since Tenure Kaivalya Nadkarni 1 May 25 1.17 Yr. Data below for DSP World Gold Fund as on 30 Jun 26
Equity Sector Allocation
Sector Value Basic Materials 94.47% Asset Allocation
Asset Class Value Cash 3.62% Equity 94.47% Debt 0% Other 1.91% Top Securities Holdings / Portfolio
Name Holding Value Quantity BGF World Gold I2
Investment Fund | -68% ₹1,141 Cr 1,005,044 VanEck Gold Miners ETF
- | GDX29% ₹490 Cr 573,719 Treps / Reverse Repo Investments
CBLO/Reverse Repo | -3% ₹54 Cr Net Receivables/Payables
Net Current Assets | -0% -₹6 Cr 5. Nippon India Power and Infra Fund
Nippon India Power and Infra Fund
Growth Launch Date 8 May 04 NAV (31 Jul 26) ₹381.086 ↑ 3.66 (0.97 %) Net Assets (Cr) ₹8,043 on 30 Jun 26 Category Equity - Sectoral AMC Nippon Life Asset Management Ltd. Rating ☆☆☆☆ Risk High Expense Ratio 1.85 Sharpe Ratio 0.24 Information Ratio 0.56 Alpha Ratio 8.81 Min Investment 5,000 Min SIP Investment 100 Exit Load 0-1 Years (1%),1 Years and above(NIL) Growth of 10,000 investment over the years.
Date Value 31 Jul 21 ₹10,000 31 Jul 22 ₹10,666 31 Jul 23 ₹15,659 31 Jul 24 ₹26,918 31 Jul 25 ₹24,246 31 Jul 26 ₹27,001 Returns for Nippon India Power and Infra Fund
absolute basis & more than 1 year are on CAGR (Compound Annual Growth Rate) basis. as on 31 Jul 26 Duration Returns 1 Month -0.8% 3 Month 0.6% 6 Month 14% 1 Year 11.4% 3 Year 19.9% 5 Year 22% 10 Year 15 Year Since launch 17.8% Historical performance (Yearly) on absolute basis
Year Returns 2025 -0.5% 2024 26.9% 2023 58% 2022 10.9% 2021 48.9% 2020 10.8% 2019 -2.9% 2018 -21.1% 2017 61.7% 2016 0.1% Fund Manager information for Nippon India Power and Infra Fund
Name Since Tenure Kinjal Desai 25 May 18 8.11 Yr. Rahul Modi 19 Aug 24 1.87 Yr. Amber Singhania 11 Mar 26 0.31 Yr. Data below for Nippon India Power and Infra Fund as on 30 Jun 26
Equity Sector Allocation
Sector Value Industrials 34.92% Utility 22.36% Consumer Cyclical 11.45% Energy 9.18% Basic Materials 6.78% Technology 4.51% Financial Services 4.09% Communication Services 2.39% Real Estate 1.47% Health Care 1.24% Asset Allocation
Asset Class Value Cash 1.59% Equity 98.41% Top Securities Holdings / Portfolio
Name Holding Value Quantity Reliance Industries Ltd (Energy)
Equity, Since 30 Nov 18 | RELIANCE8% ₹616 Cr 4,660,000 Larsen & Toubro Ltd (Industrials)
Equity, Since 30 Nov 07 | LT7% ₹557 Cr 1,366,958
↑ 20,000 NTPC Ltd (Utilities)
Equity, Since 31 May 09 | NTPC6% ₹487 Cr 12,600,000
↓ -554,060 NTPC Green Energy Ltd (Utilities)
Equity, Since 30 Nov 24 | NTPCGREEN4% ₹296 Cr 28,594,584
↑ 2,403,505 Tata Power Co Ltd (Utilities)
Equity, Since 30 Apr 23 | TATAPOWER3% ₹246 Cr 5,850,789
↓ -100,000 Bharat Heavy Electricals Ltd (Industrials)
Equity, Since 30 Sep 24 | BHEL3% ₹242 Cr 5,800,000
↓ -1,148,468 Triveni Turbine Ltd (Industrials)
Equity, Since 30 Jun 25 | TRITURBINE3% ₹237 Cr 3,193,288
↑ 120,000 Power Finance Corp Ltd (Financial Services)
Equity, Since 31 Oct 24 | PFC3% ₹198 Cr 4,620,000
↑ 720,000 Bharti Airtel Ltd (Communication Services)
Equity, Since 30 Apr 18 | BHARTIARTL2% ₹188 Cr 1,030,000
↑ 180,000 CG Power & Industrial Solutions Ltd (Industrials)
Equity, Since 30 Sep 24 | CGPOWER2% ₹174 Cr 1,893,400
↓ -276,614 6. DSP India T.I.G.E.R Fund
DSP India T.I.G.E.R Fund
Growth Launch Date 11 Jun 04 NAV (31 Jul 26) ₹359.538 ↑ 2.49 (0.70 %) Net Assets (Cr) ₹6,264 on 30 Jun 26 Category Equity - Sectoral AMC DSP BlackRock Invmt Managers Pvt. Ltd. Rating ☆☆☆☆ Risk High Expense Ratio 1.89 Sharpe Ratio 0.44 Information Ratio 0 Alpha Ratio 0 Min Investment 1,000 Min SIP Investment 500 Exit Load 0-12 Months (1%),12 Months and above(NIL) Growth of 10,000 investment over the years.
Date Value 31 Jul 21 ₹10,000 31 Jul 22 ₹10,886 31 Jul 23 ₹14,928 31 Jul 24 ₹25,470 31 Jul 25 ₹23,115 31 Jul 26 ₹26,604 Returns for DSP India T.I.G.E.R Fund
absolute basis & more than 1 year are on CAGR (Compound Annual Growth Rate) basis. as on 31 Jul 26 Duration Returns 1 Month -0.6% 3 Month 4.5% 6 Month 16.6% 1 Year 15.1% 3 Year 21.2% 5 Year 21.6% 10 Year 15 Year Since launch 17.6% Historical performance (Yearly) on absolute basis
Year Returns 2025 -2.5% 2024 32.4% 2023 49% 2022 13.9% 2021 51.6% 2020 2.7% 2019 6.7% 2018 -17.2% 2017 47% 2016 4.1% Fund Manager information for DSP India T.I.G.E.R Fund
Name Since Tenure Rohit Singhania 21 Jun 10 16.04 Yr. Data below for DSP India T.I.G.E.R Fund as on 30 Jun 26
Equity Sector Allocation
Sector Value Industrials 28.69% Basic Materials 13.29% Energy 9.47% Utility 9.46% Financial Services 8.49% Consumer Cyclical 6.52% Health Care 6.13% Communication Services 2.58% Technology 1.52% Real Estate 1.49% Consumer Defensive 0.71% Asset Allocation
Asset Class Value Cash 11.66% Equity 88.34% Top Securities Holdings / Portfolio
Name Holding Value Quantity Reliance Industries Ltd (Energy)
Equity, Since 31 Aug 19 | RELIANCE4% ₹262 Cr 1,983,815
↑ 1,304,235 NTPC Ltd (Utilities)
Equity, Since 30 Nov 17 | NTPC4% ₹249 Cr 6,433,748
↓ -94,844 Apollo Hospitals Enterprise Ltd (Healthcare)
Equity, Since 31 Dec 24 | APOLLOHOSP4% ₹247 Cr 301,630 Larsen & Toubro Ltd (Industrials)
Equity, Since 30 Jun 04 | LT4% ₹240 Cr 588,665 Kirloskar Oil Engines Ltd (Industrials)
Equity, Since 31 Mar 23 | 5332933% ₹161 Cr 834,973 Bharti Airtel Ltd (Communication Services)
Equity, Since 31 Oct 18 | BHARTIARTL3% ₹155 Cr 849,969 Coal India Ltd (Energy)
Equity, Since 31 Dec 23 | COALINDIA3% ₹154 Cr 3,352,298
↑ 647,118 INOX India Ltd (Industrials)
Equity, Since 31 Dec 23 | INOXINDIA2% ₹139 Cr 931,429
↓ -9,412 UltraTech Cement Ltd (Basic Materials)
Equity, Since 31 Dec 14 | ULTRACEMCO2% ₹135 Cr 118,010
↑ 51,464 Hindustan Aeronautics Ltd Ordinary Shares (Industrials)
Equity, Since 31 Oct 25 | HAL2% ₹131 Cr 305,098 7. Invesco India PSU Equity Fund
Invesco India PSU Equity Fund
Growth Launch Date 18 Nov 09 NAV (31 Jul 26) ₹64.91 ↑ 0.49 (0.76 %) Net Assets (Cr) ₹1,473 on 30 Jun 26 Category Equity - Sectoral AMC Invesco Asset Management (India) Private Ltd Rating ☆☆☆ Risk High Expense Ratio 2.14 Sharpe Ratio -0.16 Information Ratio -0.57 Alpha Ratio -6.88 Min Investment 5,000 Min SIP Investment 500 Exit Load 0-1 Years (1%),1 Years and above(NIL) Growth of 10,000 investment over the years.
Date Value 31 Jul 21 ₹10,000 31 Jul 22 ₹10,492 31 Jul 23 ₹14,778 31 Jul 24 ₹27,721 31 Jul 25 ₹24,471 31 Jul 26 ₹25,545 Returns for Invesco India PSU Equity Fund
absolute basis & more than 1 year are on CAGR (Compound Annual Growth Rate) basis. as on 31 Jul 26 Duration Returns 1 Month -0.5% 3 Month -3.5% 6 Month -5.1% 1 Year 4.4% 3 Year 20% 5 Year 20.6% 10 Year 15 Year Since launch 11.9% Historical performance (Yearly) on absolute basis
Year Returns 2025 10.3% 2024 25.6% 2023 54.5% 2022 20.5% 2021 31.1% 2020 6.1% 2019 10.1% 2018 -16.9% 2017 24.3% 2016 17.9% Fund Manager information for Invesco India PSU Equity Fund
Name Since Tenure Hiten Jain 1 Jul 25 1 Yr. Sagar Gandhi 1 Jul 25 1 Yr. Data below for Invesco India PSU Equity Fund as on 30 Jun 26
Equity Sector Allocation
Sector Value Financial Services 30.26% Industrials 29.89% Utility 19.1% Energy 13.91% Basic Materials 3.59% Consumer Cyclical 1.59% Asset Allocation
Asset Class Value Cash 1.66% Equity 98.34% Top Securities Holdings / Portfolio
Name Holding Value Quantity State Bank of India (Financial Services)
Equity, Since 28 Feb 21 | SBIN9% ₹128 Cr 1,323,094
↑ 151,862 Hindustan Aeronautics Ltd Ordinary Shares (Industrials)
Equity, Since 31 May 22 | HAL8% ₹112 Cr 261,137 Indian Bank (Financial Services)
Equity, Since 30 Jun 21 | INDIANB8% ₹112 Cr 1,341,970
↑ 78,651 Bharat Petroleum Corp Ltd (Energy)
Equity, Since 30 Sep 18 | BPCL6% ₹92 Cr 3,076,024 Bharat Electronics Ltd (Industrials)
Equity, Since 31 Mar 17 | BEL6% ₹85 Cr 2,078,629 Dredging Corp of India Ltd (Industrials)
Equity, Since 31 Jul 25 | DREDGECORP5% ₹75 Cr 646,300 NTPC Green Energy Ltd (Utilities)
Equity, Since 30 Nov 24 | NTPCGREEN5% ₹71 Cr 6,852,914 Bank of Baroda (Financial Services)
Equity, Since 30 Jun 21 | BANKBARODA5% ₹70 Cr 2,611,219 NTPC Ltd (Utilities)
Equity, Since 31 May 19 | NTPC5% ₹70 Cr 1,801,543 REC Ltd (Financial Services)
Equity, Since 31 Aug 23 | RECLTD4% ₹58 Cr 1,703,577 8. BOI AXA Manufacturing and Infrastructure Fund
BOI AXA Manufacturing and Infrastructure Fund
Growth Launch Date 5 Mar 10 NAV (31 Jul 26) ₹66.6 ↑ 0.16 (0.24 %) Net Assets (Cr) ₹837 on 30 Jun 26 Category Equity - Sectoral AMC BOI AXA Investment Mngrs Private Ltd Rating Risk High Expense Ratio 2.4 Sharpe Ratio 0.53 Information Ratio 0 Alpha Ratio 0 Min Investment 5,000 Min SIP Investment 1,000 Exit Load 0-1 Years (1%),1 Years and above(NIL) Growth of 10,000 investment over the years.
Date Value 31 Jul 21 ₹10,000 31 Jul 22 ₹10,684 31 Jul 23 ₹13,776 31 Jul 24 ₹22,241 31 Jul 25 ₹21,353 31 Jul 26 ₹25,170 Returns for BOI AXA Manufacturing and Infrastructure Fund
absolute basis & more than 1 year are on CAGR (Compound Annual Growth Rate) basis. as on 31 Jul 26 Duration Returns 1 Month 1.8% 3 Month 6.1% 6 Month 15% 1 Year 17.9% 3 Year 22.3% 5 Year 20.3% 10 Year 15 Year Since launch 12.3% Historical performance (Yearly) on absolute basis
Year Returns 2025 7.8% 2024 25.7% 2023 44.7% 2022 3.3% 2021 52.5% 2020 28.1% 2019 2.5% 2018 -22.8% 2017 56% 2016 1% Fund Manager information for BOI AXA Manufacturing and Infrastructure Fund
Name Since Tenure Nitin Gosar 27 Sep 22 3.76 Yr. Data below for BOI AXA Manufacturing and Infrastructure Fund as on 30 Jun 26
Equity Sector Allocation
Sector Value Industrials 24.81% Basic Materials 13.14% Consumer Cyclical 12.85% Health Care 11.87% Energy 10.92% Utility 6.13% Communication Services 4.02% Technology 3.57% Consumer Defensive 3.15% Real Estate 1.14% Asset Allocation
Asset Class Value Cash 6.24% Equity 93.66% Debt 0.1% Top Securities Holdings / Portfolio
Name Holding Value Quantity Larsen & Toubro Ltd (Industrials)
Equity, Since 31 Mar 10 | LT7% ₹52 Cr 127,443
↓ -23,672 NTPC Ltd (Utilities)
Equity, Since 31 May 21 | NTPC6% ₹48 Cr 1,250,367 Reliance Industries Ltd (Energy)
Equity, Since 31 Oct 20 | RELIANCE6% ₹47 Cr 356,510 Bharti Airtel Ltd (Communication Services)
Equity, Since 31 Dec 22 | BHARTIARTL4% ₹32 Cr 173,416 Dixon Technologies (India) Ltd (Technology)
Equity, Since 30 Apr 26 | DIXON4% ₹28 Cr 24,451
↑ 8,155 Aurobindo Pharma Ltd (Healthcare)
Equity, Since 31 May 25 | AUROPHARMA4% ₹28 Cr 196,331 Cemindia Projects Ltd (Industrials)
Equity, Since 31 Dec 22 | CEMPRO3% ₹26 Cr 243,152
↓ -65,994 Petronet LNG Ltd (Energy)
Equity, Since 31 Jan 26 | PETRONET3% ₹25 Cr 931,486
↑ 138,246 Stylam Industries Ltd (Consumer Cyclical)
Equity, Since 30 Apr 25 | 5269513% ₹24 Cr 83,372 Lloyds Metals & Energy Ltd (Basic Materials)
Equity, Since 30 Nov 24 | 5124553% ₹23 Cr 130,000
↓ -53,702 9. UTI Transportation & Logistics Fund
UTI Transportation & Logistics Fund
Growth Launch Date 11 Apr 04 NAV (31 Jul 26) ₹300.36 ↑ 3.32 (1.12 %) Net Assets (Cr) ₹3,962 on 30 Jun 26 Category Equity - Sectoral AMC UTI Asset Management Company Ltd Rating ☆☆☆ Risk High Expense Ratio 1.93 Sharpe Ratio 0.12 Information Ratio 0 Alpha Ratio 0 Min Investment 5,000 Min SIP Investment 500 Exit Load 0-1 Years (1%),1 Years and above(NIL) Growth of 10,000 investment over the years.
Date Value 31 Jul 21 ₹10,000 31 Jul 22 ₹12,359 31 Jul 23 ₹15,049 31 Jul 24 ₹23,724 31 Jul 25 ₹22,056 31 Jul 26 ₹25,144 Returns for UTI Transportation & Logistics Fund
absolute basis & more than 1 year are on CAGR (Compound Annual Growth Rate) basis. as on 31 Jul 26 Duration Returns 1 Month 7.1% 3 Month 10.7% 6 Month 6.5% 1 Year 14% 3 Year 18.7% 5 Year 20.3% 10 Year 15 Year Since launch 16.5% Historical performance (Yearly) on absolute basis
Year Returns 2025 19.5% 2024 18.7% 2023 40.1% 2022 14.7% 2021 24.3% 2020 11% 2019 -8.7% 2018 -19.5% 2017 39.6% 2016 4.8% Fund Manager information for UTI Transportation & Logistics Fund
Name Since Tenure Sachin Trivedi 22 Sep 16 9.78 Yr. Data below for UTI Transportation & Logistics Fund as on 30 Jun 26
Equity Sector Allocation
Sector Value Consumer Cyclical 79.75% Industrials 14.72% Asset Allocation
Asset Class Value Cash 5.36% Equity 94.46% Debt 0.13% Top Securities Holdings / Portfolio
Name Holding Value Quantity Mahindra & Mahindra Ltd (Consumer Cyclical)
Equity, Since 30 Apr 04 | M&M13% ₹492 Cr 1,614,940
↓ -49,846 Maruti Suzuki India Ltd (Consumer Cyclical)
Equity, Since 30 Apr 04 | MARUTI9% ₹339 Cr 258,455 Eternal Ltd (Consumer Cyclical)
Equity, Since 31 Jul 21 | ETERNAL9% ₹333 Cr 13,273,081
↑ 500,000 Eicher Motors Ltd (Consumer Cyclical)
Equity, Since 30 Nov 08 | EICHERMOT8% ₹301 Cr 419,126
↓ -44,388 Bajaj Auto Ltd (Consumer Cyclical)
Equity, Since 30 Apr 18 | BAJAJ-AUTO7% ₹263 Cr 251,657 Adani Ports & Special Economic Zone Ltd (Industrials)
Equity, Since 31 May 13 | ADANIPORTS7% ₹253 Cr 1,399,964
↑ 30,000 Hero MotoCorp Ltd (Consumer Cyclical)
Equity, Since 31 Mar 12 | HEROMOTOCO4% ₹151 Cr 308,832
↓ -18,907 Hyundai Motor India Ltd (Consumer Cyclical)
Equity, Since 31 Oct 24 | HYUNDAI4% ₹151 Cr 786,342
↑ 75,000 TVS Motor Co Ltd (Consumer Cyclical)
Equity, Since 30 Sep 19 | TVSMOTOR4% ₹147 Cr 438,430
↑ 35,000 InterGlobe Aviation Ltd (Industrials)
Equity, Since 31 May 18 | INDIGO3% ₹110 Cr 250,430 10. Canara Robeco Infrastructure
Canara Robeco Infrastructure
Growth Launch Date 2 Dec 05 NAV (31 Jul 26) ₹168.33 ↑ 1.38 (0.83 %) Net Assets (Cr) ₹998 on 30 Jun 26 Category Equity - Sectoral AMC Canara Robeco Asset Management Co. Ltd. Rating Risk High Expense Ratio 2.32 Sharpe Ratio 0.02 Information Ratio 0 Alpha Ratio 0 Min Investment 5,000 Min SIP Investment 1,000 Exit Load 0-1 Years (1%),1 Years and above(NIL) Growth of 10,000 investment over the years.
Date Value 31 Jul 21 ₹10,000 31 Jul 22 ₹11,530 31 Jul 23 ₹14,492 31 Jul 24 ₹24,387 31 Jul 25 ₹23,552 31 Jul 26 ₹24,696 Returns for Canara Robeco Infrastructure
absolute basis & more than 1 year are on CAGR (Compound Annual Growth Rate) basis. as on 31 Jul 26 Duration Returns 1 Month -1.4% 3 Month -1.6% 6 Month 7.9% 1 Year 4.9% 3 Year 19.4% 5 Year 19.8% 10 Year 15 Year Since launch 14.6% Historical performance (Yearly) on absolute basis
Year Returns 2025 0.1% 2024 35.3% 2023 41.2% 2022 9% 2021 56.1% 2020 9% 2019 2.3% 2018 -19.1% 2017 40.2% 2016 2.1% Fund Manager information for Canara Robeco Infrastructure
Name Since Tenure Vishal Mishra 26 Jun 21 5.01 Yr. Shridatta Bhandwaldar 29 Sep 18 7.76 Yr. Data below for Canara Robeco Infrastructure as on 30 Jun 26
Equity Sector Allocation
Sector Value Industrials 46.53% Utility 12.52% Basic Materials 11.01% Energy 7.46% Financial Services 6.8% Communication Services 3.99% Technology 3.66% Consumer Cyclical 2.25% Real Estate 0.9% Asset Allocation
Asset Class Value Cash 4.86% Equity 95.14% Top Securities Holdings / Portfolio
Name Holding Value Quantity Larsen & Toubro Ltd (Industrials)
Equity, Since 28 Feb 11 | LT10% ₹99 Cr 242,151
↑ 9,250 Reliance Industries Ltd (Energy)
Equity, Since 30 Apr 22 | RELIANCE5% ₹49 Cr 373,750
↑ 60,000 CG Power & Industrial Solutions Ltd (Industrials)
Equity, Since 31 Oct 23 | CGPOWER5% ₹48 Cr 525,650 NTPC Ltd (Utilities)
Equity, Since 30 Nov 18 | NTPC4% ₹41 Cr 1,066,480 Bharti Airtel Ltd (Communication Services)
Equity, Since 31 May 24 | BHARTIARTL4% ₹40 Cr 216,600
↑ 55,000 State Bank of India (Financial Services)
Equity, Since 31 Jul 24 | SBIN4% ₹39 Cr 406,500
↑ 20,000 Bharat Electronics Ltd (Industrials)
Equity, Since 31 Jul 19 | BEL4% ₹38 Cr 929,000
↑ 60,000 Tata Power Co Ltd (Utilities)
Equity, Since 30 Sep 24 | TATAPOWER4% ₹37 Cr 870,000 Cummins India Ltd (Industrials)
Equity, Since 31 Jul 24 | CUMMINSIND3% ₹33 Cr 56,000
↓ -2,500 InterGlobe Aviation Ltd (Industrials)
Equity, Since 31 Jan 23 | INDIGO3% ₹31 Cr 70,000
↑ 6,000 11. Franklin Build India Fund
Franklin Build India Fund
Growth Launch Date 4 Sep 09 NAV (31 Jul 26) ₹144.394 ↑ 0.99 (0.69 %) Net Assets (Cr) ₹3,256 on 30 Jun 26 Category Equity - Sectoral AMC Franklin Templeton Asst Mgmt(IND)Pvt Ltd Rating ☆☆☆☆☆ Risk High Expense Ratio 2.01 Sharpe Ratio -0.04 Information Ratio 0 Alpha Ratio 0 Min Investment 5,000 Min SIP Investment 500 Exit Load 0-1 Years (1%),1 Years and above(NIL) Growth of 10,000 investment over the years.
Date Value 31 Jul 21 ₹10,000 31 Jul 22 ₹10,937 31 Jul 23 ₹14,923 31 Jul 24 ₹25,030 31 Jul 25 ₹24,095 31 Jul 26 ₹24,551 Returns for Franklin Build India Fund
absolute basis & more than 1 year are on CAGR (Compound Annual Growth Rate) basis. as on 31 Jul 26 Duration Returns 1 Month -2.2% 3 Month -2% 6 Month 1.9% 1 Year 1.9% 3 Year 18.1% 5 Year 19.7% 10 Year 15 Year Since launch 17.1% Historical performance (Yearly) on absolute basis
Year Returns 2025 3.7% 2024 27.8% 2023 51.1% 2022 11.2% 2021 45.9% 2020 5.4% 2019 6% 2018 -10.7% 2017 43.3% 2016 8.4% Fund Manager information for Franklin Build India Fund
Name Since Tenure Ajay Argal 18 Oct 21 4.7 Yr. Kiran Sebastian 7 Feb 22 4.4 Yr. Sandeep Manam 18 Oct 21 4.7 Yr. Data below for Franklin Build India Fund as on 30 Jun 26
Equity Sector Allocation
Sector Value Industrials 35.44% Utility 17.21% Financial Services 13.43% Energy 12.44% Basic Materials 6.69% Communication Services 5.26% Real Estate 2.46% Consumer Cyclical 1.21% Technology 1.09% Asset Allocation
Asset Class Value Cash 4.79% Equity 95.21% Top Securities Holdings / Portfolio
Name Holding Value Quantity Larsen & Toubro Ltd (Industrials)
Equity, Since 29 Feb 20 | LT9% ₹296 Cr 725,000
↑ 125,000 InterGlobe Aviation Ltd (Industrials)
Equity, Since 29 Feb 20 | INDIGO6% ₹185 Cr 420,000 Oil & Natural Gas Corp Ltd (Energy)
Equity, Since 30 Jun 19 | ONGC6% ₹181 Cr 6,825,000 NTPC Ltd (Utilities)
Equity, Since 30 Nov 16 | NTPC6% ₹178 Cr 4,600,000 Reliance Industries Ltd (Energy)
Equity, Since 31 Oct 21 | RELIANCE5% ₹172 Cr 1,300,000 Tata Power Co Ltd (Utilities)
Equity, Since 31 Jan 25 | TATAPOWER4% ₹130 Cr 3,100,000
↑ 900,000 Bharti Airtel Ltd (Communication Services)
Equity, Since 30 Sep 09 | BHARTIARTL4% ₹130 Cr 710,000 Axis Bank Ltd (Financial Services)
Equity, Since 31 Mar 12 | AXISBANK4% ₹129 Cr 1,000,000 Power Grid Corp Of India Ltd (Utilities)
Equity, Since 28 Feb 21 | POWERGRID4% ₹126 Cr 4,350,000 HDFC Bank Ltd (Financial Services)
Equity, Since 31 Oct 25 | HDFCBANK4% ₹121 Cr 1,625,000
سرمایہ کاروں کو مشورہ دیا جاتا ہے کہ وہ اپنی پسند کے SIP منصوبوں میں سرمایہ کاری کریں۔ مذکورہ بالا 11 میوچل فنڈز ہر قسم کے سرمایہ کاروں کے لیے موزوں ہیں۔ تو، یا تو آپ کو زیادہ خطرہ ہے۔سرمایہ کار یا نسبتاً کم، یہ SIP فنڈز ہیں۔سرمایہ کاری کے لیے بہترین میوچل فنڈز. تو، انتظار نہ کریں، ابھی سرمایہ کاری کریں!
بہترین نظامی سرمایہ کاری کے منصوبوں میں سرمایہ کاری کرتے وقت جن پیرامیٹرز پر غور کرنا ہے۔
بہترین کارکردگی کا مظاہرہ کرنے والے SIP فنڈز کا جائزہ لینے کے لیے، آئیے ان عوامل کو جانتے ہیں جن پر سرمایہ کاری کرنے سے پہلے غور کرنا چاہیے۔
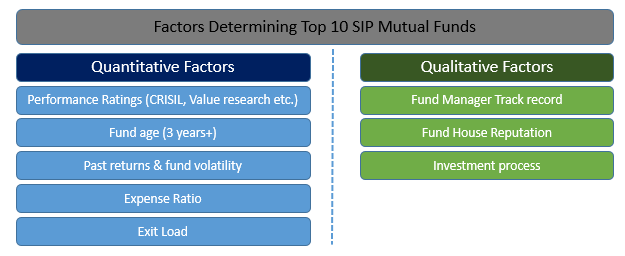
اعلی SIP میں سرمایہ کاری کے لیے مقداری عوامل
ایس آئی پی کے ذریعے سرمایہ کاری کرنے سے پہلے جن مقداری عوامل پر غور کرنا چاہیے ان میں کارکردگی کی درجہ بندی (بطور CRISIL، ویلیو ریسرچ وغیرہ)، فنڈ کی عمر، ماضی کے منافع اور فنڈ میں اتار چڑھاؤ، اخراجات کا تناسب اور ایگزٹ لوڈ شامل ہیں۔
اعلی SIP میں سرمایہ کاری کرنے کے قابلیت والے عوامل
تجزیہ کرنے کے لیے کوالٹیٹو کلیدی اعدادوشمار میں فنڈ مینیجر کا ٹریک ریکارڈ، فنڈ ہاؤس کی ساکھ اور SIP فنڈ کی سرمایہ کاری کا عمل شامل ہے۔
SIP MF آن لائن میں کیسے سرمایہ کاری کی جائے؟
Fincash.com پر لائف ٹائم کے لیے مفت انویسٹمنٹ اکاؤنٹ کھولیں۔
اپنی رجسٹریشن اور KYC کا عمل مکمل کریں۔
دستاویزات اپ لوڈ کریں (PAN، آدھار، وغیرہ)۔اور، آپ سرمایہ کاری کے لیے تیار ہیں!
آج ہی SIP کے ساتھ اپنا سرمایہ کاری کا سفر شروع کریں!
اکثر پوچھے گئے سوالات
1. میوچل فنڈز کیا ہیں؟
A: میوچل فنڈز سسٹمیٹک انویسٹمنٹ پلان یا ایس آئی پی کا حصہ ہیں جو عام طور پر بعد میں بہترین منافع دیتے ہیں۔ جب تممیوچل فنڈز میں سرمایہ کاری کریں۔، آپ اپنے سرمایہ کاری کے پورٹ فولیو کو متنوع بناتے ہیں۔ ایک میوچل فنڈ کو ایک سرمایہ کاری کا آلہ سمجھا جا سکتا ہے جسے کسی نے تیار کیا ہے۔اثاثہ مینجمنٹ کمپنی متعدد سرمایہ کاروں اور کمپنیوں کی سرمایہ کاری کو جمع کرکے۔
2. میوچل فنڈز کی مختلف اقسام کیا ہیں؟
A: میوچل فنڈز کو وسیع پیمانے پر درج ذیل اقسام میں تقسیم کیا جا سکتا ہے۔
- ایکویٹی یا گروتھ فنڈز
- فکسڈ انکم فنڈز یاقرض فنڈ
- ٹیکس بچانے والے فنڈز
- مائع فنڈز
- متوازن فنڈ
- گلٹ فنڈز
- ایکسچینج ٹریڈڈ فنڈز یاETFs
3. گروتھ ایکویٹی فنڈز کیا ہیں؟
A: نشو نماایکویٹی فنڈز سب سے زیادہ عام میوچل فنڈز ہیں۔ تاہم، یہ پورٹ فولیو غیر مستحکم سرمایہ کاری پر مشتمل ہوگا۔ اس کے باوجود، سرمایہ کار اکثر گروتھ ایکویٹی فنڈز کو ترجیح دیتے ہیں کیونکہ ان میں زیادہ منافع ہوتا ہے اور ایک مختصر مدت کے لیے سرمایہ کاری کی جا سکتی ہے۔
4. آپ کو قرض فنڈ میں سرمایہ کاری کیوں کرنی چاہیے؟
A: یہ سرمایہ کاری ان افراد کے لیے مثالی ہے جو سرمایہ کاری پر مقررہ منافع کی تلاش میں ہیں۔ مقررہ آمدنی ڈیبینچرز، ڈیٹ سیکیورٹیز، کمرشل پیپرز اور گورنمنٹ سیکیورٹیز سے حاصل کی جاسکتی ہے۔ میوچل فنڈز مختلف قسم کی سرمایہ کاری کا ایک پورٹ فولیو بنائے گا اور خطرے کو ختم کرے گا۔
5. آپ کو SIPs میں کیوں سرمایہ کاری کرنی چاہیے؟
A: SIPs سرمایہ کار کو یقینی آمدنی فراہم کر سکتے ہیں۔ اگر آپ غیر فعال آمدنی حاصل کرنے میں دلچسپی رکھتے ہیں اور اس بات کو یقینی بنانا چاہتے ہیں کہ آپ کی سرمایہ کاری باقاعدہ آمدنی پیدا کرے، تو آپ SIPs میں سرمایہ کاری کرنے پر غور کر سکتے ہیں۔ .
6. ٹیکس بچانے والے میوچل فنڈ میں کیوں سرمایہ کاری کریں؟
A: اگر آپ اپنی ترقی کے خواہاں ہیں۔سرمایہ اور ایک ہی وقت میں ٹیکس کی چھوٹ سے لطف اندوز ہونا چاہتے ہیں، تو آپ ٹیکس بچانے والے میوچل فنڈ میں سرمایہ کاری کر سکتے ہیں۔ کے تحتسیکشن 80 سی کےانکم ٹیکس 1861 کا ایکٹ، اگر آپ ایکویٹی سے منسلک ٹیکس بچانے والے میوچل فنڈز میں سرمایہ کاری کرتے ہیں، تو آپ اپنی سرمایہ کاری پر ٹیکس میں چھوٹ حاصل کر سکتے ہیں۔
7. کیا مجھے میوچل فنڈز میں سرمایہ کاری کرنے کے لیے بروکر کی ضرورت ہے؟
A: سرمایہ کاری میں مدد کے لیے آپ کو بروکر یا مالیاتی ادارے کے تعاون کی ضرورت ہوگی۔ آپ کو مناسب SIPs کی شناخت کرنے اور اس بات کو یقینی بنانے کے لیے مدد کی ضرورت ہوگی کہ سرمایہ کاری صحیح طریقے سے کی گئی ہے۔
یہاں فراہم کردہ معلومات کے درست ہونے کو یقینی بنانے کے لیے تمام کوششیں کی گئی ہیں۔ تاہم، ڈیٹا کی درستگی کے حوالے سے کوئی ضمانت نہیں دی جاتی ہے۔ براہ کرم کوئی بھی سرمایہ کاری کرنے سے پہلے اسکیم کی معلومات کے دستاویز کے ساتھ تصدیق کریں۔


AMFI Registration No. 112358 | CIN: U74999MH2016PTC282153
Shepard Technologies Pvt. Ltd. (with ARN code 112358) makes no warranties or representations, express or implied, on products offered through the platform. It accepts no liability for any damages or losses, however caused, in connection with the use of, or on the reliance of its product or related services. Terms and conditions of the website are applicable.
©2026 Shepard Technologies Private Limited. All Rights Reserved
Research Highlights for ICICI Prudential Infrastructure Fund