Life Time Free Mutual Funds Investment Account
Welcome to the World of Fincash.com!
First of all, we would like to thank you for choosing us as your Mutual Fund investment channel.
Are you a beginner? Are you a seasoned investor? Don’t worry, all your needs will be catered. Be Rest Assured as we are always there to guide you at every step whether related to investments, product selection, registration or any other query. So, let’s move ahead to have a better understanding of the features of the Life Time Free Mutual Funds Investment Account along with the registration process.
Talk to our investment specialist
Why Fincash.com Investment Account?
Fincash.com always believes in “Customer First” policy. We always ensure to provide top-notch customer service by keeping in mind the client’s requirements and how effectively it can be fulfilled. Our aim is to create value for your money so that you can achieve your goals within the timeframe. Some of the investor-friendly features of Fincash.com include:
- User-friendly website so that you get maximum information in minimum clicks
- Lifetime Active & Free Account where investors need not pay any money even if they don’t transact.
- Easy Registration Process where people need not spend much time.
- KYC Compliance which can be done within our framework through eKYC and is indeed helpful for first-timers.
- Safety & Security are always on our priority where; we ensure that client’s data and all their transactions both are kept confidential.
- Wide Range of Schemes which people can choose as per their requirements.
- Customized Solutions of Fincash.com that helps investors to ease out their product selection process under the categories of ELSS, SIPs, and Tax Saving Scheme.
Registration Process for Fincash.com
Well, the registration process to open your Life Time Free Mutual Fund Investment Account is quite simple. To complete your registration, you require:
- An active mobile number
- PAN number
- Aadhar Number
- Scanned Copy/Image of personalized cancelled cheque, Bank statement, Front Page of Passbook
- Scanned Copy/Image of your Signature
let us look at the registration process:
Step 1: Create Your Login
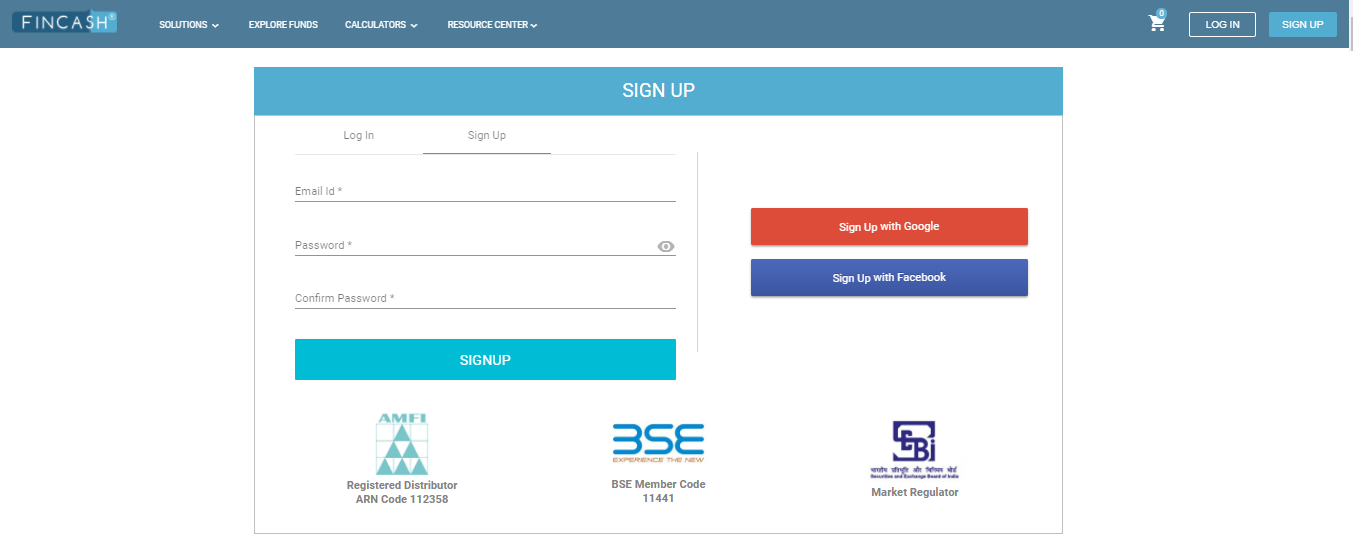
The First step begins with creating your login. To create your login id, first you need to visit the website of www.fincash.com and click on the SIGN UP button on the top right side of the screen After clicking on this button, you need to enter your email address and password. This login id will be used by you whenever while transacting. So, be sure that you give your correct and valid email address. You can even do social signup using Facebook or Gmail id. The image showing the login button tab and the login screen is shown below.
Step 2: Mobile Verification
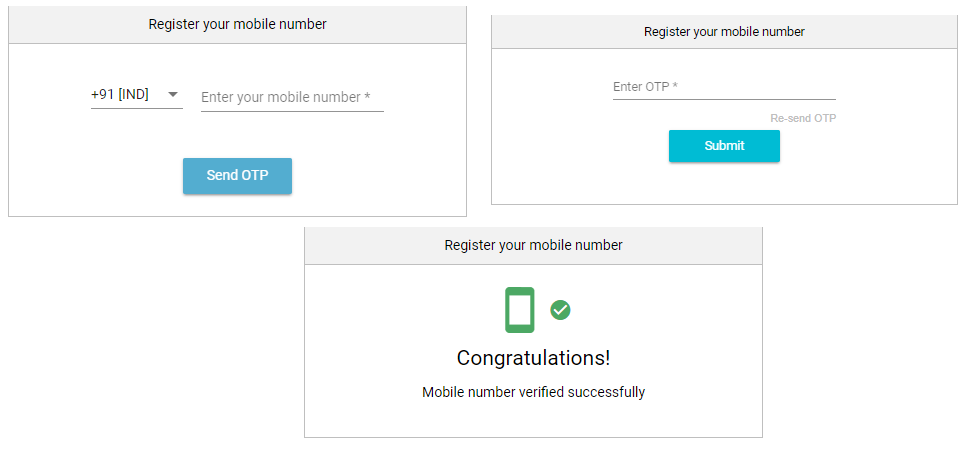
After creating your login id, the next step deals with verification of mobile number. In other words, post creation of login id, the screen gets redirected to mobile number verification where people need to enter their mobile number. Upon entering the mobile number, they receive a One Time Password (OTP) through SMS which again needs to be entered on the screen. So, be careful that you enter your correct and active mobile number. Also, while entering the OTP, ensure that all the characters are entered correctly. The image for the second step is as follows.
Step 3: PAN MF KYC Status Check
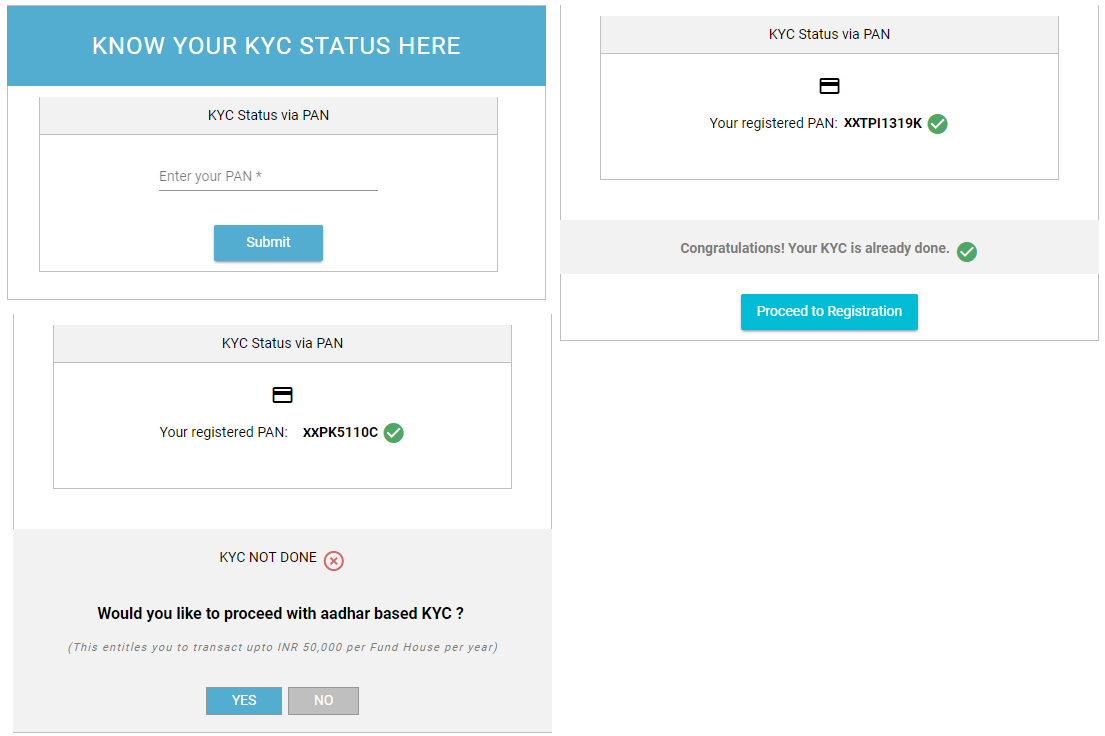
The Third step ensures that, whether you are a KYC compliant investor or not. MF KYC or Know-Your-Customer is a one-time process that you need to complete before Investing money in Mutual Funds. The KYC Status is verified using your PAN. If you have already completed your KYC process, then you will get a pop up for the same and can proceed with the registration process.
Step 4: Registration Form
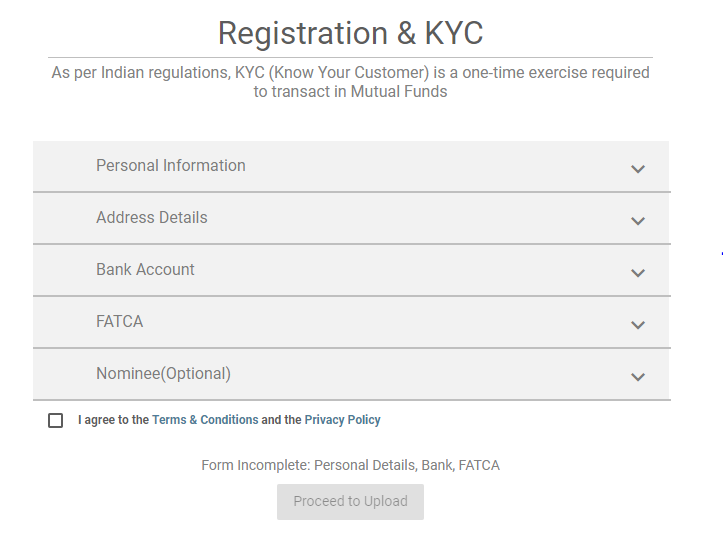
This process needs to be completed by all individuals. For registration purposes, you need to fill in the form, that is spread out into 5 different tabs. These tabs include personal information, address details, bank account, FATCA details, and nominee. By filling all the tabs and uploading the relevant documents, you complete the complete KYC process and can invest up to any amount in Mutual Funds. After filling all the details, you need to click on the check box, to proceed to the next step. The image showing the various tabs of registration form along with the check box is as shown below.
4:1- Fill Personal Information
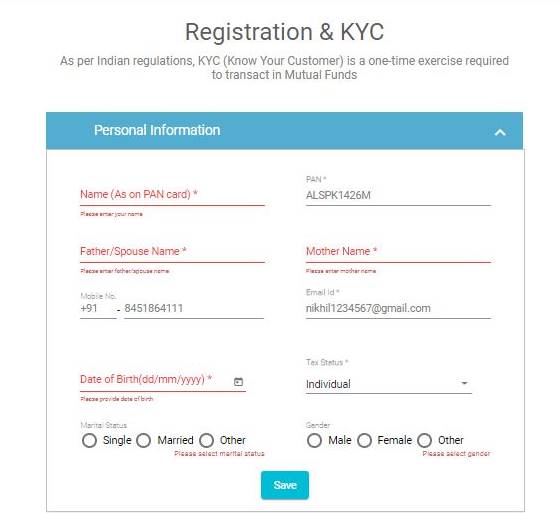
When you click on the Personal Information option, you will have to fill details like
- Name (as on PAN Card)
- PAN number
- Father/Spouse name
- Mobile number
- Email address
- Date of Birth (dd/mm/yyyy format)
- Tax status (options in drop-down)
At the bottom if have to choose your martial status and gender. Click on the save button.
4:2- Fill Address Details
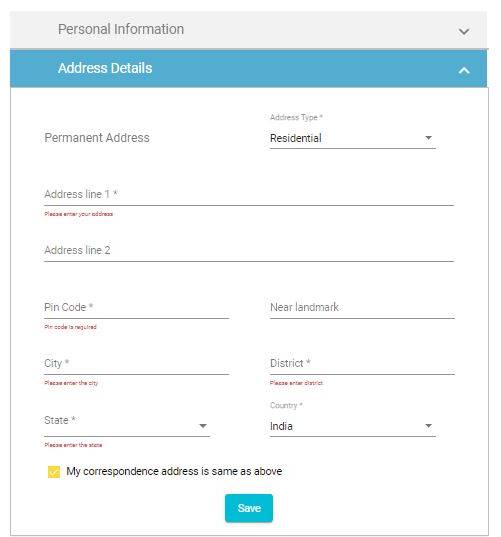
In the address details section, fill the following information:
- Address types (the options are given in the drop-down)
- Address details
- Pin code
- Landmark
- City
- District
- State
- Country
At the bottom, click on the yellow button and save the details.
4:3- Bank Details
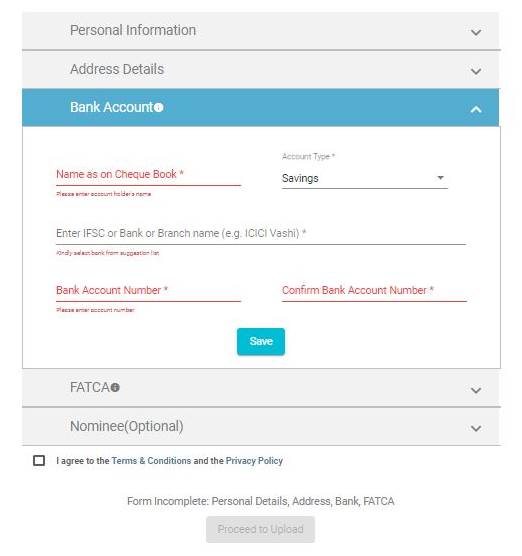
For registration, you need to fill your bank details like:
- Name (as on bank cheque)
- Account type (options in the drop-down)
- IFSC code
- Bank account number
- Confirm bank account number
Once you fill all the information, save the details.
4:4- FATCA
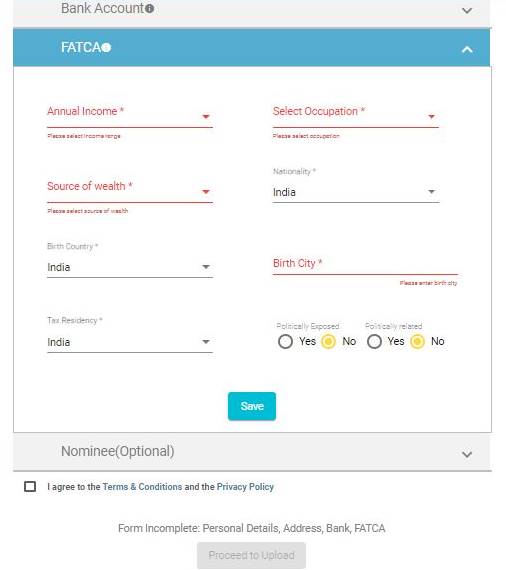
In FATCA, following are the information to fill, there are drop-downs given:
- Annual income
- Occupation
- Source of wealth
- Nationality
- Birth country
- Birth city
- Tax residency
At the bottom you need to select if you are politically exposed or politically related.
4:4- Nominee (Optional)
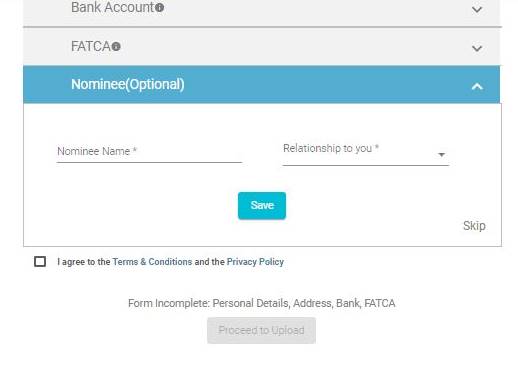
Adding nominee is optional. If you choose to fill, add the nominee name and choose the relation you share.
Once filled, accept the Terms & Conditions and proceed to upload documents.
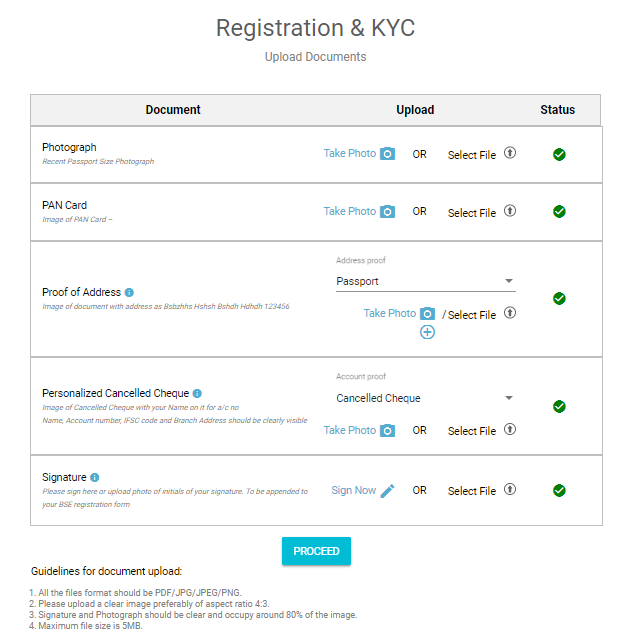
Step 5: Upload Documents
This is the final step in your registration process. If you have completed the KYC process, then you just need to upload:
- Scanned copy/Image of your signature and
- Scanned copy/Image of your personalized cheque.
However, if you have not completed the eKYC and you are not KYC compliant then along with the above-mentioned documents, you need to upload
- Photograph
- Scanned copy/Image of PAN card and
- Scanned copy/Image of Address Proof
In case of upload documents, the display of the screen is given below as follows.
Thus, we can see that the registration process is quite simple. Now the final part that is the customized solutions of Fincash.com. The USP of Fincash.com is its customized solutions that help in easing out the product selection process.
Fincash Solutions
These three solutions are for general investment need are :
SavingsPlus
This solution is suitable for people having idle money in their savings bank account and are looking for avenues to augment more income. savingsplus is a bundle of top three Liquid Fund schemes that offer more returns as compared to the Savings Account. Additionally, these funds are considered as a safe investment avenue. Some of the features of SavingsPlus are:
- Higher returns
- Instant redemption
- No lock-in or exit load
- Invest and redeem in a click
SmartSIP
smartsip is a bundle of top three equity fund schemes that are considered to be stable and have earned good returns over a period of time. Its apt for people having long-term investment period. As the name suggests SIP, people can invest small amounts in this schemes to attain their objectives. The features of SmartSIP include:
- Pre-selected top 3 SIP schemes
- Schemes selected after an analysis of 20,000 schemes
- Earn healthy returns
TaxSaver
The third solution taxsaver is a bundle of two Equity Mutual Funds that give the advantages of investing and tax benefits. Through TaxSaver, people can claim a tax deduction up to INR 1,50,000 under Section 80C of income tax Act, 1961 for a particular Financial Year. Being Tax Saving Investments, they have a lock-in period of three years. Their features include:
- Selected after analysis across ELSS category
- Pre-selected top 2 best Equity Linked Saving Schemes(ELSS)
- Save tax and earn healthy returns
Fund Selection Methodology used to find 5 funds
Best Mutual Funds to Start Investments
Below is the list of best mutual funds once can invest having Net Assets/ AUM above 500 Crore.
"The primary investment objective of the Scheme is to seek capital appreciation by investing predominantly in units of MLIIF - WGF. The Scheme may, at the discretion of the Investment Manager, also invest in the units of other similar overseas mutual fund schemes, which may constitute a significant part of its corpus. The Scheme may also invest a certain portion of its corpus in money market securities and/or units of money market/liquid schemes of DSP Merrill Lynch Mutual Fund, in order to meet liquidity requirements from time to time. However, there is no assurance that the investment objective of the Scheme will be realized." Below is the key information for DSP World Gold Fund Returns up to 1 year are on The primary investment objective of the Scheme is to seek capital appreciation by investing predominantly in units of BGF – USFEF. The Scheme may, at the discretion of the Investment Manager also invest in the units of other similar overseas mutual fund schemes, which may constitute a significant part of its corpus. The Scheme may also invest a certain portion of its corpus in money market securities and/or money market/liquid schemes of DSP BlackRock Mutual Fund, in order to meet liquidity requirements from time to time. However, there is no assurance that the investment objective of the Scheme will be realized. It shall be noted ‘similar overseas mutual fund schemes’ shall have investment objective, investment strategy and risk profile/consideration similar to those of BGF – USFEF. Research Highlights for DSP US Flexible Equity Fund Below is the key information for DSP US Flexible Equity Fund Returns up to 1 year are on (Erstwhile UTI Pharma & Healthcare Fund) The Investment objective of the Scheme is capital appreciation through investments in equities and equity related instruments of the Pharma & Healthcare sectors. Research Highlights for UTI Healthcare Fund Below is the key information for UTI Healthcare Fund Returns up to 1 year are on The objective of the scheme would be to provide investors with opportunities for long-term growth in capital along with the liquidity of an open-ended scheme through an active management of investments in a diversified basket of equity stocks of domestic Public Sector Undertakings and in debt and money market instruments issued by PSUs AND others. Research Highlights for SBI PSU Fund Below is the key information for SBI PSU Fund Returns up to 1 year are on The investment objective of the scheme is to provide long term growth from a portfolio of equity / equity related instruments of companies engaged either directly or indirectly in the infrastructure sector. Research Highlights for LIC MF Infrastructure Fund Below is the key information for LIC MF Infrastructure Fund Returns up to 1 year are on 1. DSP World Gold Fund
DSP World Gold Fund
Growth Launch Date 14 Sep 07 NAV (14 Jul 26) ₹50.3205 ↑ 1.24 (2.53 %) Net Assets (Cr) ₹1,679 on 31 May 26 Category Equity - Global AMC DSP BlackRock Invmt Managers Pvt. Ltd. Rating ☆☆☆ Risk High Expense Ratio 1.41 Sharpe Ratio 1.77 Information Ratio -0.78 Alpha Ratio -0.46 Min Investment 1,000 Min SIP Investment 500 Exit Load 0-12 Months (1%),12 Months and above(NIL) Growth of 10,000 investment over the years.
Date Value 30 Jun 21 ₹10,000 30 Jun 22 ₹8,181 30 Jun 23 ₹9,294 30 Jun 24 ₹10,640 30 Jun 25 ₹16,808 30 Jun 26 ₹27,693 Returns for DSP World Gold Fund
absolute basis & more than 1 year are on CAGR (Compound Annual Growth Rate) basis. as on 14 Jul 26 Duration Returns 1 Month -3.7% 3 Month -20.3% 6 Month -15% 1 Year 62.3% 3 Year 41.3% 5 Year 22.3% 10 Year 15 Year Since launch 9% Historical performance (Yearly) on absolute basis
Year Returns 2025 167.1% 2024 15.9% 2023 7% 2022 -7.7% 2021 -9% 2020 31.4% 2019 35.1% 2018 -10.7% 2017 -4% 2016 52.7% Fund Manager information for DSP World Gold Fund
Name Since Tenure Kaivalya Nadkarni 1 May 25 1.17 Yr. Data below for DSP World Gold Fund as on 31 May 26
Equity Sector Allocation
Sector Value Basic Materials 94.47% Asset Allocation
Asset Class Value Cash 3.62% Equity 94.47% Debt 0% Other 1.91% Top Securities Holdings / Portfolio
Name Holding Value Quantity BGF World Gold I2
Investment Fund | -68% ₹1,141 Cr 1,005,044 VanEck Gold Miners ETF
- | GDX29% ₹490 Cr 573,719 Treps / Reverse Repo Investments
CBLO/Reverse Repo | -3% ₹54 Cr Net Receivables/Payables
Net Current Assets | -0% -₹6 Cr 2. DSP US Flexible Equity Fund
DSP US Flexible Equity Fund
Growth Launch Date 3 Aug 12 NAV (14 Jul 26) ₹94.3323 ↑ 0.32 (0.34 %) Net Assets (Cr) ₹1,323 on 31 May 26 Category Equity - Global AMC DSP BlackRock Invmt Managers Pvt. Ltd. Rating ☆☆☆☆☆ Risk High Expense Ratio 1.55 Sharpe Ratio 2.57 Information Ratio 0.13 Alpha Ratio -3.23 Min Investment 1,000 Min SIP Investment 500 Exit Load 0-12 Months (1%),12 Months and above(NIL) Growth of 10,000 investment over the years.
Date Value 30 Jun 21 ₹10,000 30 Jun 22 ₹9,273 30 Jun 23 ₹11,265 30 Jun 24 ₹13,557 30 Jun 25 ₹15,785 30 Jun 26 ₹23,371 Returns for DSP US Flexible Equity Fund
absolute basis & more than 1 year are on CAGR (Compound Annual Growth Rate) basis. as on 14 Jul 26 Duration Returns 1 Month 2.3% 3 Month 14.8% 6 Month 20.9% 1 Year 48.9% 3 Year 27% 5 Year 18.2% 10 Year 15 Year Since launch 17.5% Historical performance (Yearly) on absolute basis
Year Returns 2025 33.8% 2024 17.8% 2023 22% 2022 -5.9% 2021 24.2% 2020 22.6% 2019 27.5% 2018 -1.1% 2017 15.5% 2016 9.8% Fund Manager information for DSP US Flexible Equity Fund
Name Since Tenure Kaivalya Nadkarni 1 May 25 1.17 Yr. Data below for DSP US Flexible Equity Fund as on 31 May 26
Equity Sector Allocation
Sector Value Technology 33.05% Industrials 13.62% Financial Services 12.17% Communication Services 12.05% Consumer Cyclical 9.62% Health Care 7.65% Basic Materials 2.45% Energy 2.43% Asset Allocation
Asset Class Value Cash 6.96% Equity 93.02% Debt 0.01% Top Securities Holdings / Portfolio
Name Holding Value Quantity BGF US Flexible Equity I2
Investment Fund | -96% ₹1,265 Cr 1,784,131
↓ -32,921 Treps / Reverse Repo Investments
CBLO/Reverse Repo | -4% ₹59 Cr Net Receivables/Payables
Net Current Assets | -0% -₹2 Cr 3. UTI Healthcare Fund
UTI Healthcare Fund
Growth Launch Date 28 Jun 99 NAV (15 Jul 26) ₹333.939 ↑ 1.66 (0.50 %) Net Assets (Cr) ₹1,217 on 31 May 26 Category Equity - Sectoral AMC UTI Asset Management Company Ltd Rating ☆ Risk High Expense Ratio 2.26 Sharpe Ratio 0.42 Information Ratio 0.08 Alpha Ratio 0.91 Min Investment 5,000 Min SIP Investment 500 Exit Load 0-1 Years (1%),1 Years and above(NIL) Growth of 10,000 investment over the years.
Date Value 30 Jun 21 ₹10,000 30 Jun 22 ₹8,478 30 Jun 23 ₹10,006 30 Jun 24 ₹14,264 30 Jun 25 ₹17,337 30 Jun 26 ₹19,764 Returns for UTI Healthcare Fund
absolute basis & more than 1 year are on CAGR (Compound Annual Growth Rate) basis. as on 14 Jul 26 Duration Returns 1 Month 7.2% 3 Month 17.5% 6 Month 19% 1 Year 13.6% 3 Year 25.8% 5 Year 14.6% 10 Year 15 Year Since launch 15% Historical performance (Yearly) on absolute basis
Year Returns 2025 -3.1% 2024 42.9% 2023 38.2% 2022 -12.3% 2021 19.1% 2020 67.4% 2019 1.2% 2018 -7.5% 2017 6.2% 2016 -9.7% Fund Manager information for UTI Healthcare Fund
Name Since Tenure Kamal Gada 2 May 22 4.17 Yr. Data below for UTI Healthcare Fund as on 31 May 26
Equity Sector Allocation
Sector Value Health Care 94.45% Asset Allocation
Asset Class Value Cash 5.55% Equity 94.45% Top Securities Holdings / Portfolio
Name Holding Value Quantity Sun Pharmaceuticals Industries Ltd (Healthcare)
Equity, Since 31 Oct 06 | SUNPHARMA9% ₹108 Cr 600,000 Divi's Laboratories Ltd (Healthcare)
Equity, Since 30 Sep 17 | DIVISLAB5% ₹59 Cr 88,814
↑ 28,076 Ajanta Pharma Ltd (Healthcare)
Equity, Since 31 Jul 17 | AJANTPHARM5% ₹57 Cr 195,295
↓ -41,216 Gland Pharma Ltd (Healthcare)
Equity, Since 30 Nov 20 | GLAND4% ₹48 Cr 215,251 Lupin Ltd (Healthcare)
Equity, Since 28 Feb 25 | LUPIN4% ₹46 Cr 203,834
↓ -6,166 Apollo Hospitals Enterprise Ltd (Healthcare)
Equity, Since 30 Apr 21 | APOLLOHOSP4% ₹43 Cr 53,000 Dr Reddy's Laboratories Ltd (Healthcare)
Equity, Since 28 Feb 18 | DRREDDY3% ₹38 Cr 290,000 Caplin Point Laboratories Ltd (Healthcare)
Equity, Since 31 Dec 23 | CAPLIPOINT3% ₹37 Cr 185,000
↑ 39,847 Alkem Laboratories Ltd (Healthcare)
Equity, Since 31 May 21 | ALKEM3% ₹37 Cr 68,000 Fortis Healthcare Ltd (Healthcare)
Equity, Since 31 Dec 20 | FORTIS3% ₹37 Cr 400,000 4. SBI PSU Fund
SBI PSU Fund
Growth Launch Date 7 Jul 10 NAV (15 Jul 26) ₹34.4616 ↑ 0.11 (0.31 %) Net Assets (Cr) ₹6,594 on 31 May 26 Category Equity - Sectoral AMC SBI Funds Management Private Limited Rating ☆☆ Risk High Expense Ratio 1.89 Sharpe Ratio 0.26 Information Ratio -0.02 Alpha Ratio 0.16 Min Investment 5,000 Min SIP Investment 500 Exit Load 0-1 Years (1%),1 Years and above(NIL) Growth of 10,000 investment over the years.
Date Value 30 Jun 21 ₹10,000 30 Jun 22 ₹9,973 30 Jun 23 ₹13,609 30 Jun 24 ₹26,792 30 Jun 25 ₹26,602 30 Jun 26 ₹28,255 Returns for SBI PSU Fund
absolute basis & more than 1 year are on CAGR (Compound Annual Growth Rate) basis. as on 14 Jul 26 Duration Returns 1 Month -1.2% 3 Month -3.5% 6 Month 0.6% 1 Year 6.6% 3 Year 25.6% 5 Year 23.1% 10 Year 15 Year Since launch 8% Historical performance (Yearly) on absolute basis
Year Returns 2025 11.3% 2024 23.5% 2023 54% 2022 29% 2021 32.4% 2020 -10% 2019 6% 2018 -23.8% 2017 21.9% 2016 16.2% Fund Manager information for SBI PSU Fund
Name Since Tenure Rohit Shimpi 1 Jun 24 2.08 Yr. Data below for SBI PSU Fund as on 31 May 26
Equity Sector Allocation
Sector Value Financial Services 32.54% Utility 31.22% Industrials 14.07% Energy 11.97% Basic Materials 6.94% Asset Allocation
Asset Class Value Cash 3.18% Equity 96.74% Debt 0.07% Top Securities Holdings / Portfolio
Name Holding Value Quantity State Bank of India (Financial Services)
Equity, Since 31 Jul 10 | SBIN17% ₹1,112 Cr 11,527,500
↑ 1,000,000 GAIL (India) Ltd (Utilities)
Equity, Since 31 May 24 | GAIL10% ₹628 Cr 38,150,000 NTPC Ltd (Utilities)
Equity, Since 31 Jul 10 | NTPC9% ₹597 Cr 15,443,244 Bharat Electronics Ltd (Industrials)
Equity, Since 30 Jun 24 | BEL9% ₹583 Cr 14,185,000
↑ 800,000 Power Grid Corp Of India Ltd (Utilities)
Equity, Since 31 Jul 10 | POWERGRID9% ₹579 Cr 19,935,554 Oil & Natural Gas Corp Ltd (Energy)
Equity, Since 31 May 20 | ONGC6% ₹389 Cr 14,655,000 Bank of Baroda (Financial Services)
Equity, Since 31 Aug 24 | BANKBARODA5% ₹352 Cr 13,100,000 Bharat Petroleum Corp Ltd (Energy)
Equity, Since 31 Aug 24 | BPCL4% ₹289 Cr 9,700,000 Bharat Heavy Electricals Ltd (Industrials)
Equity, Since 30 Jun 25 | BHEL4% ₹271 Cr 6,500,000 NMDC Ltd (Basic Materials)
Equity, Since 31 Oct 23 | NMDC4% ₹245 Cr 27,900,000 5. LIC MF Infrastructure Fund
LIC MF Infrastructure Fund
Growth Launch Date 29 Feb 08 NAV (15 Jul 26) ₹54.4288 ↑ 0.08 (0.15 %) Net Assets (Cr) ₹1,099 on 31 May 26 Category Equity - Sectoral AMC LIC Mutual Fund Asset Mgmt Co Ltd Rating Risk High Expense Ratio 2.21 Sharpe Ratio 0.26 Information Ratio 0.55 Alpha Ratio 4.51 Min Investment 5,000 Min SIP Investment 1,000 Exit Load 0-1 Years (1%),1 Years and above(NIL) Growth of 10,000 investment over the years.
Date Value 30 Jun 21 ₹10,000 30 Jun 22 ₹11,137 30 Jun 23 ₹14,179 30 Jun 24 ₹26,268 30 Jun 25 ₹26,896 30 Jun 26 ₹29,151 Returns for LIC MF Infrastructure Fund
absolute basis & more than 1 year are on CAGR (Compound Annual Growth Rate) basis. as on 14 Jul 26 Duration Returns 1 Month 1% 3 Month 7.8% 6 Month 13.3% 1 Year 7.7% 3 Year 25.5% 5 Year 22.8% 10 Year 15 Year Since launch 9.7% Historical performance (Yearly) on absolute basis
Year Returns 2025 -3.7% 2024 47.8% 2023 44.4% 2022 7.9% 2021 46.6% 2020 -0.1% 2019 13.3% 2018 -14.6% 2017 42.2% 2016 -2.2% Fund Manager information for LIC MF Infrastructure Fund
Name Since Tenure Sumit Bhatnagar 7 Apr 26 0.23 Yr. Mahesh Bendre 1 Jul 24 2 Yr. Data below for LIC MF Infrastructure Fund as on 31 May 26
Equity Sector Allocation
Sector Value Industrials 37.05% Consumer Cyclical 20.88% Basic Materials 12.42% Utility 11.88% Communication Services 5.02% Financial Services 3.98% Real Estate 1.97% Health Care 1.89% Technology 1.08% Asset Allocation
Asset Class Value Cash 3.82% Equity 96.18% Top Securities Holdings / Portfolio
Name Holding Value Quantity Larsen & Toubro Ltd (Industrials)
Equity, Since 30 Apr 09 | LT4% ₹44 Cr 106,968
↓ -10,884 Garware Hi-Tech Films Ltd (Basic Materials)
Equity, Since 31 Aug 23 | 5006554% ₹40 Cr 65,325
↓ -7,684 Tata Motors Passenger Vehicles Ltd (Consumer Cyclical)
Equity, Since 28 Feb 26 | TMPV4% ₹39 Cr 982,891
↓ -332,760 Tata Motors Ltd (Consumer Cyclical)
Equity, Since 31 Oct 25 | TMCV4% ₹39 Cr 1,015,933
↑ 26,983 Tata Power Co Ltd (Utilities)
Equity, Since 29 Feb 24 | TATAPOWER3% ₹36 Cr 861,040
↑ 524,312 KSH International Ltd (Industrials)
Equity, Since 31 Dec 25 | KSHINTL3% ₹34 Cr 432,816
↑ 6,280 Siemens Energy India Ltd (Utilities)
Equity, Since 31 Aug 25 | ENRIN3% ₹34 Cr 87,106
↑ 24,800 JSW Infrastructure Ltd (Industrials)
Equity, Since 30 Apr 26 | JSWINFRA3% ₹31 Cr 1,133,858
↑ 745,681 Carraro India Ltd (Consumer Cyclical)
Equity, Since 31 Dec 24 | CARRARO3% ₹31 Cr 572,991 Bharat Dynamics Ltd Ordinary Shares (Industrials)
Equity, Since 31 Jan 26 | BDL3% ₹29 Cr 242,954
↑ 157,744
So, do you want to be a smart investor and make money? Register and invest with Fincash.com and create wealth for your future.
All efforts have been made to ensure the information provided here is accurate. However, no guarantees are made regarding correctness of data. Please verify with scheme information document before making any investment.


AMFI Registration No. 112358 | CIN: U74999MH2016PTC282153
Shepard Technologies Pvt. Ltd. (with ARN code 112358) makes no warranties or representations, express or implied, on products offered through the platform. It accepts no liability for any damages or losses, however caused, in connection with the use of, or on the reliance of its product or related services. Terms and conditions of the website are applicable.
©2026 Shepard Technologies Private Limited. All Rights Reserved
Research Highlights for DSP World Gold Fund