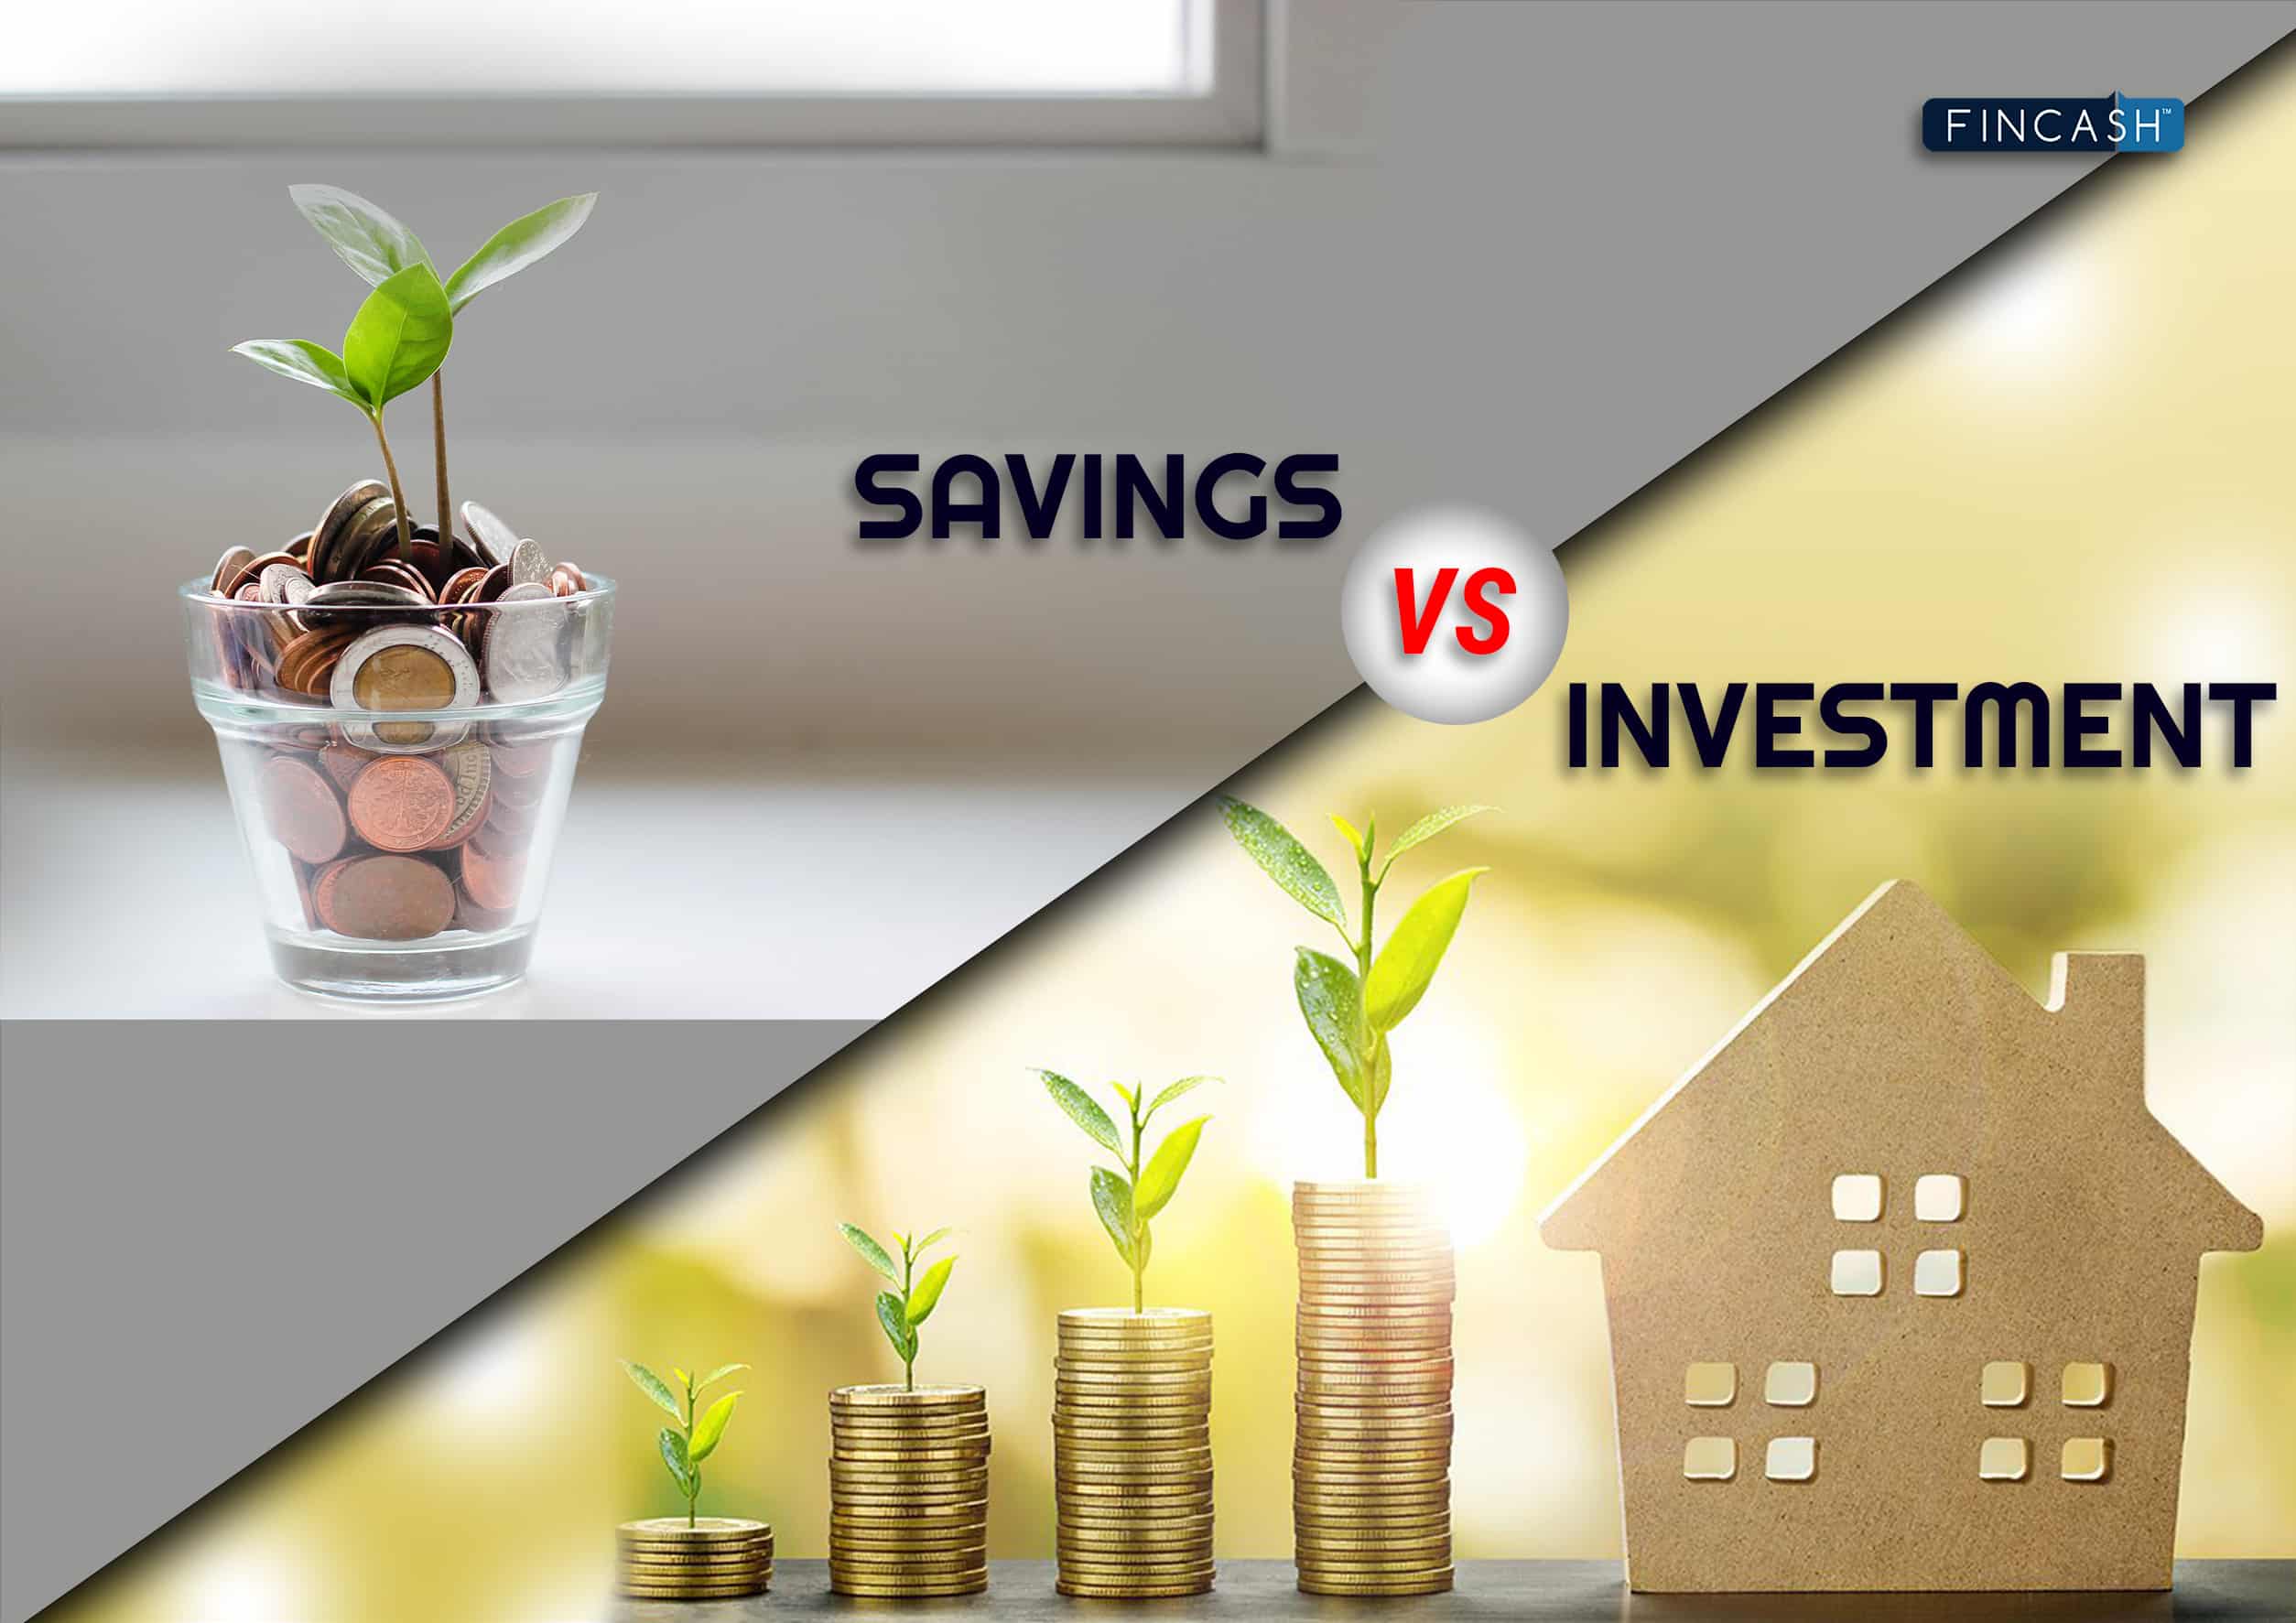
بچت اور سرمایہ کاری کے درمیان فرق
آج کی دنیا میں، مالی تحفظ کے حصول کے لیے بچت اور سرمایہ کاری کی بنیادی باتوں کو سمجھنا ضروری ہے۔ اپنے مالی معاملات کے بارے میں ہوشیار فیصلے کر کے، آپ اپنے اور اپنے خاندان کے لیے ایک محفوظ مستقبل بنا سکتے ہیں۔ اس گائیڈ کا مقصد بچت اور سرمایہ کاری کے ساتھ ساتھ کچھ بنیادی اصولوں کو متعارف کرانا ہے۔معاشی منصوبہ بندی. ہم مختلف قسم کی سرمایہ کاری کی گاڑیوں کے بارے میں بات کریں گے، کیسےپیسے بچاؤبجٹ سازی کی تکنیکریٹائرمنٹ پلاننگ حکمت عملی، اور مزید. ہاتھ میں مناسب علم کے ساتھ، جب سرمایہ کاری کرنے یا ریٹائرمنٹ کا منصوبہ بنانے کا وقت آتا ہے تو آپ باخبر فیصلے کر سکتے ہیں۔
ایک مؤثر مالیاتی حکمت عملی کے لیے ایک جامع نقطہ نظر کی ضرورت ہوتی ہے جو تمام پہلوؤں پر غور کرے۔ذاتی اقتصادٹیکس کے قوانین سمیت،انشورنس پالیسیاں، اسٹیٹ پلاننگ کے تحفظات، قرض کے انتظام کے مسائل، اور وقت کے ساتھ ساتھ پائیدار دولت کی تعمیر سے متعلق دیگر عوامل۔سرمایہ کاری دانشمندی سے اب مستقبل میں زیادہ منافع حاصل ہو سکتا ہے، لہذا صحیح طریقے سے بچت اور سرمایہ کاری کے بارے میں جاننے کے لیے ابھی وقت نکالیں!
بچت اور سرمایہ کاری کے درمیان کلیدی فرق
بچت اور سرمایہ کاری دو الگ الگ مالی اصطلاحات ہیں جنہیں لوگ اکثر ایک دوسرے کے بدلے استعمال کرتے ہیں۔ تاہم، بچت اور سرمایہ کاری کے درمیان اہم فرق کو سمجھنا ضروری ہے، کیونکہ وہ مختلف مقاصد کو پورا کرتے ہیں۔ بچت میں رقم کو محفوظ جگہ پر رکھ کر مستقبل کے استعمال کے لیے مختص کرنا شامل ہے جیسے کہ aبینک کھاتہ،معیاد مقررہ تک جمع یا دیگر محفوظ سرمایہ کاری۔ دوسری طرف، سرمایہ کاری میں، جیسے آلات میں پیسہ لگانا شامل ہے۔باہمی چندہ، سونا، اسٹاک،ETFs، وغیرہ، اضافی پیدا کرنے کے مقصد کے ساتھآمدنی یاسرمایہ وقت کے ساتھ فائدہ.
بچت اور سرمایہ کاری کے درمیان ایک اہم فرق یہ ہے کہ بچت آپ کو بہت کم منافع دیتی ہے اور کم خطرہ ہے۔ اگرچہ سرمایہ کاری خطرناک ہو سکتی ہے لیکن ممکنہ طور پر زیادہ منافع پیدا کر سکتی ہے۔ اس کے علاوہ، بچتوں میں تحفظ کی ضمانت ہوتی ہے، جبکہ سرمایہ کاری میں مزید شامل ہو سکتے ہیں۔اتار چڑھاؤ اس پر منحصرمارکیٹ حالات بالآخر، یہ آپ پر منحصر ہے کہ آپ یہ فیصلہ کرتے وقت کتنا خطرہ مول لینے کو تیار ہیں کہ آپ کی ضروریات اور مقاصد کے مطابق کس قسم کی سرگرمی بہترین ہے۔
| بچت | سرمایہ کاری |
|---|---|
| آپ اپنے قلیل مدتی اہداف کو پورا کر سکتے ہیں اور تمام غیر منصوبہ بند اخراجات کا انتظام کر سکتے ہیں۔ | آپ دولت پیدا کر سکتے ہیں اور اےپورٹ فولیو، اس سرمائے کی تعریف کرتے ہوئے جو آپ سرمایہ کاری کر رہے ہیں۔ |
| یہ مختصر مدت کے فوائد کے لئے مثالی ہے | یہ طویل مدتی فوائد کے لیے مثالی ہے کیونکہ یہ مثبت منافع دیتا ہے۔ |
| آپ کو زیادہ قیمتی واپسی فراہم نہیں کرتا ہے۔ | اگر آپ صحیح سرمایہ کاری کی حکمت عملی پر عمل پیرا ہیں تو یہ آپ کو بھاری منافع حاصل کرنے میں مدد کرتا ہے۔ |
| رقم کی بچت میں کوئی خطرہ نہیں ہے۔ | یہ مارکیٹ کے خطرات کا شکار ہے اور اگر آپ مارکیٹ کے رجحانات اور تجزیہ پر عمل نہیں کر رہے ہیں تو اس میں نقصانات شامل ہو سکتے ہیں |
| آپ ڈپازٹس کے سرٹیفکیٹ، پیسہ کمانے کے آلات، اور اوپننگ اے کا استعمال کرتے ہوئے اپنے پیسے بچا سکتے ہیں۔بچت اکاونٹ | آپ اسٹاک میں سرمایہ کاری کر سکتے ہیں،بانڈز، ETFs، اور میوچل فنڈز ایک سرمایہ کاری پورٹ فولیو بنانے کے لیے |
Talk to our investment specialist
ایک متوازن مالیاتی منصوبہ بنانے کے لیے 50-20-30 اصول کا استعمال کریں۔
متوازن بنانامالی منصوبہ بچت بمقابلہ سرمایہ کاری کے تناسب پر غور کرنے کی ضرورت ہے۔ بچت اور سرمایہ کاری دونوں ذاتی مالیات کے لازمی پہلو ہیں، اور طویل مدتی مالی استحکام حاصل کرنے کے لیے دونوں کے درمیان توازن برقرار رکھنا بہت ضروری ہے۔ تناسب اس بات کا تعین کرنے کا ایک طریقہ ہے کہ آپ کو اپنی آمدنی کا کتنا حصہ ہر ماہ بچت اور سرمایہ کاری کے لیے مختص کرنا چاہیے۔
اصول بتاتا ہے کہ آپ کو اپنی بعد از ٹیکس آمدنی کو تین زمروں میں تقسیم کرنا چاہیے:
ضروریات (50%): اس زمرے میں وہ تمام ضروری اخراجات شامل ہیں جو آپ کو ہر ماہ ادا کرنے ہوں گے، جیسے کہ کرایہ، قرض، افادیت، گروسری، ٹرانسپورٹیشن، اور انشورنس۔
بچت اور قرض میں کمی (20%): اس زمرے میں کوئی بھی رقم شامل ہے جسے آپ نے طویل مدتی اہداف کے لیے مختص کیا ہے، جیسے ریٹائرمنٹ کی بچت یا قرض کی ادائیگی۔ اس زمرے کو آپ کے "مالی کشن" کے نام سے بھی جانا جاتا ہے کیونکہ یہ آپ کو ہنگامی حالات میں حفاظتی جال بنانے میں مدد کرتا ہے۔
چاہتا ہے (30%): اس زمرے میں کوئی بھی صوابدیدی اخراجات شامل ہیں جو آپ کرنے کا انتخاب کرتے ہیں، جیسے باہر کھانا، تفریح، سفر یا شوق۔
50-20-30 اصول پر عمل کرنے سے آپ کو ایک متوازن مالیاتی منصوبہ بنانے میں مدد مل سکتی ہے جو آپ کو اپنی ضروری ضروریات کو پورا کرنے، مستقبل کے لیے بچت کرنے، اور کچھ ایسی چیزوں سے لطف اندوز ہونے دیتا ہے جو زیادہ خرچ کیے بغیر زندگی کو خوشگوار بناتی ہیں۔ تاہم، یہ یاد رکھنا ضروری ہے کہ یہ صرف ایک رہنما خطوط ہے، اور آپ کو اپنی منفرد مالی صورتحال اور ترجیحات کے مطابق اسے ایڈجسٹ کرنا چاہیے۔
کیوں سرمایہ کاری بچت سے بہتر ہے۔
سرمایہ کاری بہت سے فوائد پیش کرتی ہے جن کی روایتی بچت کھاتوں میں کمی ہے، جو اسے ذاتی مالیات کا ایک اہم پہلو بناتی ہے۔ سرمایہ کاری کا ایک بڑا فائدہ بچت کھاتوں سے زیادہ منافع کا امکان ہے کیونکہ اثاثے جیسے اسٹاک، میوچل فنڈز، اورریل اسٹیٹ کی وقت کے ساتھ قدر کی تعریف کر سکتے ہیں۔ ان اثاثوں میں سرمایہ کاری کرکے، افراد ایسے منافع کما سکتے ہیں جو بچت کھاتوں کے ذریعہ پیش کردہ سود کی شرحوں کو پیچھے چھوڑ دیتے ہیں۔ سرمایہ کاری کا ایک اور فائدہ دولت کو بڑھانے کی صلاحیت ہے۔مرکب، جہاں ریٹرن کی دوبارہ سرمایہ کاری کی جاتی ہے تاکہ اس سے بھی زیادہ منافع حاصل کیا جا سکے۔
اس سے افراد کو طویل مدتی حاصل کرنے میں مدد ملتی ہے۔مالی اہدافجیسے ریٹائرمنٹ کے لیے بچت کرنا یا گھر خریدنا۔ مزید برآں، سرمایہ کاری تنوع کی اجازت دیتی ہے، جو مختلف شعبوں اور صنعتوں میں سرمایہ کاری کو پھیلا کر خطرے کو کم کرنے میں مدد کر سکتی ہے۔ مجموعی طور پر، سمجھ کرسرمایہ کاری کے فوائد اور باخبر سرمایہ کاری کے فیصلے کرتے ہوئے، افراد اپنے مالی اہداف حاصل کر سکتے ہیں اور اپنے مالی مستقبل کو محفوظ بنا سکتے ہیں۔
2023 میں سرمایہ کاری کے لیے بہترین میوچل فنڈز
میوچل فنڈز میں سرمایہ کاری وقت کے ساتھ آپ کے پیسے بڑھانے کے بہترین طریقوں میں سے ایک ہے۔ جیسے جیسے بازار بڑھتے اور گرتے ہیں، متنوع پورٹ فولیو کا ہونا جس میں سرمایہ کاری جیسے میوچل فنڈز شامل ہوتے ہیں، مارکیٹ میں مندی کے دوران آپ کو ہونے والے نقصانات کو دور کرنے میں مدد مل سکتی ہے۔ 2023 کے لیے درج ذیل کچھ اعلیٰ درجہ کے میوچل فنڈز ہیں جن پر آپ کو سرمایہ کاری کرنے پر غور کرنا چاہیے۔
"The primary investment objective of the Scheme is to seek capital appreciation by investing predominantly in units of MLIIF - WGF. The Scheme may, at the discretion of the Investment Manager, also invest in the units of other similar overseas mutual fund schemes, which may constitute a significant part of its corpus. The Scheme may also invest a certain portion of its corpus in money market securities and/or units of money market/liquid schemes of DSP Merrill Lynch Mutual Fund, in order to meet liquidity requirements from time to time. However, there is no assurance that the investment objective of the Scheme will be realized." Below is the key information for DSP World Gold Fund Returns up to 1 year are on The objective of the scheme would be to provide investors with opportunities for long-term growth in capital along with the liquidity of an open-ended scheme through an active management of investments in a diversified basket of equity stocks of domestic Public Sector Undertakings and in debt and money market instruments issued by PSUs AND others. Research Highlights for SBI PSU Fund Below is the key information for SBI PSU Fund Returns up to 1 year are on To generate capital appreciation and income distribution to unit holders by investing predominantly in equity/equity related securities of the companies belonging to the infrastructure development and balance in debt securities and money market instruments. Research Highlights for ICICI Prudential Infrastructure Fund Below is the key information for ICICI Prudential Infrastructure Fund Returns up to 1 year are on The investment objective of the scheme is to provide long term growth from a portfolio of equity / equity related instruments of companies engaged either directly or indirectly in the infrastructure sector. Research Highlights for LIC MF Infrastructure Fund Below is the key information for LIC MF Infrastructure Fund Returns up to 1 year are on (Erstwhile Reliance Diversified Power Sector Fund) The primary investment objective of the scheme is to generate long term capital appreciation by investing predominantly in equity and equity related securities of companies in the power sector. Research Highlights for Nippon India Power and Infra Fund Below is the key information for Nippon India Power and Infra Fund Returns up to 1 year are on To generate capital appreciation, from a portfolio that is substantially constituted of equity securities and equity related securities of corporates, which could benefit from structural changes brought about by continuing liberalization in economic policies by the government and/or continuing investments in infrastructure, both by the public and private sector. Research Highlights for DSP India T.I.G.E.R Fund Below is the key information for DSP India T.I.G.E.R Fund Returns up to 1 year are on To generate capital appreciation by investing in Equity and Equity Related Instruments of companies where the Central / State Government(s) has majority shareholding or management control or has powers to appoint majority of directors. However, there is no assurance or guarantee that the investment objective of the Scheme will be achieved. The Scheme does not assure or guarantee any returns. Research Highlights for Invesco India PSU Equity Fund Below is the key information for Invesco India PSU Equity Fund Returns up to 1 year are on The Scheme seeks to generate long term capital appreciation through a portfolio of predominantly equity and equity related securities of companies engaged in manufacturing and infrastructure and related sectors. Further, there can be no assurance that the investment objectives of the scheme will be realized. The Scheme is not providing any assured or guaranteed returns Research Highlights for BOI AXA Manufacturing and Infrastructure Fund Below is the key information for BOI AXA Manufacturing and Infrastructure Fund Returns up to 1 year are on T o g e n e r a t e income/capital appreciation by investing in equities and equity related instruments of companies in the infrastructure sector. However, there can be no assurance that the investment objective of the scheme will be realized. Research Highlights for Canara Robeco Infrastructure Below is the key information for Canara Robeco Infrastructure Returns up to 1 year are on The Scheme seeks to achieve capital appreciation by investing in companies engaged directly or indirectly in infrastructure related activities. Research Highlights for Franklin Build India Fund Below is the key information for Franklin Build India Fund Returns up to 1 year are on To seek long-term capital appreciation by investing predominantly in equity and equity related securities of companies engaged in or expected to benefit from growth and development of infrastructure. Research Highlights for HDFC Infrastructure Fund Below is the key information for HDFC Infrastructure Fund Returns up to 1 year are on Fund NAV Net Assets (Cr) Min SIP Investment 3 MO (%) 6 MO (%) 1 YR (%) 3 YR (%) 5 YR (%) 2025 (%) DSP World Gold Fund Growth ₹50.1271
↓ -1.40 ₹1,433 500 -16.7 -23.5 57.5 42.3 23.2 167.1 SBI PSU Fund Growth ₹34.1868
↓ -0.04 ₹6,684 500 -6 2.3 5.8 23.3 22.9 11.3 ICICI Prudential Infrastructure Fund Growth ₹199.47
↓ -0.50 ₹8,550 100 0 7.4 0.4 19.2 22.9 6.7 LIC MF Infrastructure Fund Growth ₹53.4108
↓ -0.10 ₹1,137 1,000 4 16.5 5.8 24.5 22.2 -3.7 Nippon India Power and Infra Fund Growth ₹376.558
↓ -0.45 ₹8,043 100 0.8 17.2 8.6 20.6 21.7 -0.5 DSP India T.I.G.E.R Fund Growth ₹356.825
↓ -0.65 ₹6,264 500 4.9 20.1 12.6 22.4 21.7 -2.5 Invesco India PSU Equity Fund Growth ₹64.09
↓ -0.13 ₹1,473 500 -6.1 -1.4 -0.3 20.4 20.6 10.3 BOI AXA Manufacturing and Infrastructure Fund Growth ₹65.94
↓ -0.02 ₹837 1,000 7.4 18.4 14.6 23 20.2 7.8 Canara Robeco Infrastructure Growth ₹166.11
↓ -0.64 ₹998 1,000 -2.8 11.3 2.6 20 19.6 0.1 Franklin Build India Fund Growth ₹142.088
↓ -0.63 ₹3,256 500 -3.2 4.3 -0.6 18.6 19.2 3.7 HDFC Infrastructure Fund Growth ₹46.361
↓ -0.09 ₹2,444 300 -1.6 2.8 -3.9 16.8 19.1 2.2 Note: Returns up to 1 year are on absolute basis & more than 1 year are on CAGR basis. as on 23 Jul 26 Research Highlights & Commentary of 11 Funds showcased
Commentary DSP World Gold Fund SBI PSU Fund ICICI Prudential Infrastructure Fund LIC MF Infrastructure Fund Nippon India Power and Infra Fund DSP India T.I.G.E.R Fund Invesco India PSU Equity Fund BOI AXA Manufacturing and Infrastructure Fund Canara Robeco Infrastructure Franklin Build India Fund HDFC Infrastructure Fund Point 1 Lower mid AUM (₹1,433 Cr). Upper mid AUM (₹6,684 Cr). Highest AUM (₹8,550 Cr). Bottom quartile AUM (₹1,137 Cr). Top quartile AUM (₹8,043 Cr). Upper mid AUM (₹6,264 Cr). Lower mid AUM (₹1,473 Cr). Bottom quartile AUM (₹837 Cr). Bottom quartile AUM (₹998 Cr). Upper mid AUM (₹3,256 Cr). Lower mid AUM (₹2,444 Cr). Point 2 Established history (18+ yrs). Established history (16+ yrs). Established history (20+ yrs). Established history (18+ yrs). Established history (22+ yrs). Oldest track record among peers (22 yrs). Established history (16+ yrs). Established history (16+ yrs). Established history (20+ yrs). Established history (16+ yrs). Established history (18+ yrs). Point 3 Rating: 3★ (upper mid). Rating: 2★ (lower mid). Rating: 3★ (upper mid). Not Rated. Rating: 4★ (upper mid). Rating: 4★ (top quartile). Rating: 3★ (lower mid). Not Rated. Not Rated. Top rated. Rating: 3★ (lower mid). Point 4 Risk profile: High. Risk profile: High. Risk profile: High. Risk profile: High. Risk profile: High. Risk profile: High. Risk profile: High. Risk profile: High. Risk profile: High. Risk profile: High. Risk profile: High. Point 5 5Y return: 23.23% (top quartile). 5Y return: 22.93% (top quartile). 5Y return: 22.87% (upper mid). 5Y return: 22.24% (upper mid). 5Y return: 21.72% (upper mid). 5Y return: 21.69% (lower mid). 5Y return: 20.64% (lower mid). 5Y return: 20.24% (lower mid). 5Y return: 19.55% (bottom quartile). 5Y return: 19.15% (bottom quartile). 5Y return: 19.12% (bottom quartile). Point 6 3Y return: 42.34% (top quartile). 3Y return: 23.32% (upper mid). 3Y return: 19.23% (bottom quartile). 3Y return: 24.49% (top quartile). 3Y return: 20.61% (lower mid). 3Y return: 22.36% (upper mid). 3Y return: 20.37% (lower mid). 3Y return: 23.04% (upper mid). 3Y return: 19.96% (lower mid). 3Y return: 18.60% (bottom quartile). 3Y return: 16.79% (bottom quartile). Point 7 1Y return: 57.48% (top quartile). 1Y return: 5.82% (lower mid). 1Y return: 0.42% (lower mid). 1Y return: 5.84% (upper mid). 1Y return: 8.61% (upper mid). 1Y return: 12.56% (upper mid). 1Y return: -0.30% (bottom quartile). 1Y return: 14.58% (top quartile). 1Y return: 2.57% (lower mid). 1Y return: -0.58% (bottom quartile). 1Y return: -3.92% (bottom quartile). Point 8 Alpha: 2.12 (upper mid). Alpha: -0.30 (bottom quartile). Alpha: 0.00 (upper mid). Alpha: 8.41 (top quartile). Alpha: 8.81 (top quartile). Alpha: 0.00 (bottom quartile). Alpha: -6.88 (bottom quartile). Alpha: 0.00 (lower mid). Alpha: 0.00 (lower mid). Alpha: 0.00 (lower mid). Alpha: 0.00 (upper mid). Point 9 Sharpe: 1.22 (top quartile). Sharpe: 0.12 (lower mid). Sharpe: -0.07 (bottom quartile). Sharpe: 0.22 (upper mid). Sharpe: 0.24 (upper mid). Sharpe: 0.44 (upper mid). Sharpe: -0.16 (bottom quartile). Sharpe: 0.53 (top quartile). Sharpe: 0.02 (lower mid). Sharpe: -0.04 (lower mid). Sharpe: -0.23 (bottom quartile). Point 10 Information ratio: -0.50 (bottom quartile). Information ratio: -0.11 (bottom quartile). Information ratio: 0.00 (upper mid). Information ratio: 0.58 (top quartile). Information ratio: 0.56 (top quartile). Information ratio: 0.00 (upper mid). Information ratio: -0.57 (bottom quartile). Information ratio: 0.00 (lower mid). Information ratio: 0.00 (lower mid). Information ratio: 0.00 (lower mid). Information ratio: 0.00 (upper mid). DSP World Gold Fund
SBI PSU Fund
ICICI Prudential Infrastructure Fund
LIC MF Infrastructure Fund
Nippon India Power and Infra Fund
DSP India T.I.G.E.R Fund
Invesco India PSU Equity Fund
BOI AXA Manufacturing and Infrastructure Fund
Canara Robeco Infrastructure
Franklin Build India Fund
HDFC Infrastructure Fund
200 کروڑ میوچل فنڈز کی ایکویٹی کیٹیگری میں 5 سالہ کیلنڈر سال کے ریٹرن کی بنیاد پر آرڈر کیا گیا ہے۔1. DSP World Gold Fund
DSP World Gold Fund
Growth Launch Date 14 Sep 07 NAV (23 Jul 26) ₹50.1271 ↓ -1.40 (-2.72 %) Net Assets (Cr) ₹1,433 on 30 Jun 26 Category Equity - Global AMC DSP BlackRock Invmt Managers Pvt. Ltd. Rating ☆☆☆ Risk High Expense Ratio 1.41 Sharpe Ratio 1.22 Information Ratio -0.5 Alpha Ratio 2.12 Min Investment 1,000 Min SIP Investment 500 Exit Load 0-12 Months (1%),12 Months and above(NIL) Growth of 10,000 investment over the years.
Date Value 30 Jun 21 ₹10,000 30 Jun 22 ₹8,181 30 Jun 23 ₹9,294 30 Jun 24 ₹10,640 30 Jun 25 ₹16,808 30 Jun 26 ₹27,693 Returns for DSP World Gold Fund
absolute basis & more than 1 year are on CAGR (Compound Annual Growth Rate) basis. as on 23 Jul 26 Duration Returns 1 Month -5.9% 3 Month -16.7% 6 Month -23.5% 1 Year 57.5% 3 Year 42.3% 5 Year 23.2% 10 Year 15 Year Since launch 8.9% Historical performance (Yearly) on absolute basis
Year Returns 2025 167.1% 2024 15.9% 2023 7% 2022 -7.7% 2021 -9% 2020 31.4% 2019 35.1% 2018 -10.7% 2017 -4% 2016 52.7% Fund Manager information for DSP World Gold Fund
Name Since Tenure Kaivalya Nadkarni 1 May 25 1.17 Yr. Data below for DSP World Gold Fund as on 30 Jun 26
Equity Sector Allocation
Sector Value Basic Materials 94.47% Asset Allocation
Asset Class Value Cash 3.62% Equity 94.47% Debt 0% Other 1.91% Top Securities Holdings / Portfolio
Name Holding Value Quantity BGF World Gold I2
Investment Fund | -68% ₹1,141 Cr 1,005,044 VanEck Gold Miners ETF
- | GDX29% ₹490 Cr 573,719 Treps / Reverse Repo Investments
CBLO/Reverse Repo | -3% ₹54 Cr Net Receivables/Payables
Net Current Assets | -0% -₹6 Cr 2. SBI PSU Fund
SBI PSU Fund
Growth Launch Date 7 Jul 10 NAV (24 Jul 26) ₹34.1868 ↓ -0.04 (-0.10 %) Net Assets (Cr) ₹6,684 on 30 Jun 26 Category Equity - Sectoral AMC SBI Funds Management Private Limited Rating ☆☆ Risk High Expense Ratio 1.89 Sharpe Ratio 0.12 Information Ratio -0.11 Alpha Ratio -0.3 Min Investment 5,000 Min SIP Investment 500 Exit Load 0-1 Years (1%),1 Years and above(NIL) Growth of 10,000 investment over the years.
Date Value 30 Jun 21 ₹10,000 30 Jun 22 ₹9,973 30 Jun 23 ₹13,609 30 Jun 24 ₹26,792 30 Jun 25 ₹26,602 30 Jun 26 ₹28,255 Returns for SBI PSU Fund
absolute basis & more than 1 year are on CAGR (Compound Annual Growth Rate) basis. as on 23 Jul 26 Duration Returns 1 Month -2.4% 3 Month -6% 6 Month 2.3% 1 Year 5.8% 3 Year 23.3% 5 Year 22.9% 10 Year 15 Year Since launch 8% Historical performance (Yearly) on absolute basis
Year Returns 2025 11.3% 2024 23.5% 2023 54% 2022 29% 2021 32.4% 2020 -10% 2019 6% 2018 -23.8% 2017 21.9% 2016 16.2% Fund Manager information for SBI PSU Fund
Name Since Tenure Rohit Shimpi 1 Jun 24 2.08 Yr. Data below for SBI PSU Fund as on 30 Jun 26
Equity Sector Allocation
Sector Value Financial Services 32.54% Utility 31.22% Industrials 14.07% Energy 11.97% Basic Materials 6.94% Asset Allocation
Asset Class Value Cash 3.18% Equity 96.74% Debt 0.07% Top Securities Holdings / Portfolio
Name Holding Value Quantity State Bank of India (Financial Services)
Equity, Since 31 Jul 10 | SBIN17% ₹1,112 Cr 11,527,500
↑ 1,000,000 GAIL (India) Ltd (Utilities)
Equity, Since 31 May 24 | GAIL10% ₹628 Cr 38,150,000 NTPC Ltd (Utilities)
Equity, Since 31 Jul 10 | NTPC9% ₹597 Cr 15,443,244 Bharat Electronics Ltd (Industrials)
Equity, Since 30 Jun 24 | BEL9% ₹583 Cr 14,185,000
↑ 800,000 Power Grid Corp Of India Ltd (Utilities)
Equity, Since 31 Jul 10 | POWERGRID9% ₹579 Cr 19,935,554 Oil & Natural Gas Corp Ltd (Energy)
Equity, Since 31 May 20 | ONGC6% ₹389 Cr 14,655,000 Bank of Baroda (Financial Services)
Equity, Since 31 Aug 24 | BANKBARODA5% ₹352 Cr 13,100,000 Bharat Petroleum Corp Ltd (Energy)
Equity, Since 31 Aug 24 | BPCL4% ₹289 Cr 9,700,000 Bharat Heavy Electricals Ltd (Industrials)
Equity, Since 30 Jun 25 | BHEL4% ₹271 Cr 6,500,000 NMDC Ltd (Basic Materials)
Equity, Since 31 Oct 23 | NMDC4% ₹245 Cr 27,900,000 3. ICICI Prudential Infrastructure Fund
ICICI Prudential Infrastructure Fund
Growth Launch Date 31 Aug 05 NAV (24 Jul 26) ₹199.47 ↓ -0.50 (-0.25 %) Net Assets (Cr) ₹8,550 on 30 Jun 26 Category Equity - Sectoral AMC ICICI Prudential Asset Management Company Limited Rating ☆☆☆ Risk High Expense Ratio 1.89 Sharpe Ratio -0.07 Information Ratio 0 Alpha Ratio 0 Min Investment 5,000 Min SIP Investment 100 Exit Load 0-1 Years (1%),1 Years and above(NIL) Growth of 10,000 investment over the years.
Date Value 30 Jun 21 ₹10,000 30 Jun 22 ₹11,534 30 Jun 23 ₹16,346 30 Jun 24 ₹27,296 30 Jun 25 ₹28,743 30 Jun 26 ₹29,425 Returns for ICICI Prudential Infrastructure Fund
absolute basis & more than 1 year are on CAGR (Compound Annual Growth Rate) basis. as on 23 Jul 26 Duration Returns 1 Month -3.2% 3 Month 0% 6 Month 7.4% 1 Year 0.4% 3 Year 19.2% 5 Year 22.9% 10 Year 15 Year Since launch 15.4% Historical performance (Yearly) on absolute basis
Year Returns 2025 6.7% 2024 27.4% 2023 44.6% 2022 28.8% 2021 50.1% 2020 3.6% 2019 2.6% 2018 -14% 2017 40.8% 2016 2% Fund Manager information for ICICI Prudential Infrastructure Fund
Name Since Tenure Ihab Dalwai 3 Jun 17 9.08 Yr. Sharmila D’mello 30 Jun 22 4.01 Yr. Data below for ICICI Prudential Infrastructure Fund as on 30 Jun 26
Equity Sector Allocation
Sector Value Industrials 47.57% Financial Services 10.57% Utility 10.32% Basic Materials 9.74% Real Estate 8.09% Energy 5.04% Consumer Cyclical 1.98% Communication Services 0.09% Asset Allocation
Asset Class Value Cash 5.83% Equity 94.17% Top Securities Holdings / Portfolio
Name Holding Value Quantity InterGlobe Aviation Ltd (Industrials)
Equity, Since 28 Feb 23 | INDIGO9% ₹745 Cr 1,691,985
↑ 50,000 Larsen & Toubro Ltd (Industrials)
Equity, Since 30 Nov 09 | LT7% ₹614 Cr 1,505,704 Oberoi Realty Ltd (Real Estate)
Equity, Since 31 May 23 | OBEROIRLTY4% ₹365 Cr 2,139,426 Gujarat Energy Ltd (Utilities)
Equity, Since 31 Jan 23 | GUJGASLTD4% ₹340 Cr 8,482,024
↑ 156,557 NTPC Ltd (Utilities)
Equity, Since 29 Feb 16 | NTPC4% ₹334 Cr 8,626,448 Shree Cement Ltd (Basic Materials)
Equity, Since 30 Apr 24 | SHREECEM3% ₹270 Cr 106,892
↑ 3,387 Kalpataru Projects International Ltd (Industrials)
Equity, Since 30 Sep 06 | KPIL3% ₹262 Cr 2,005,608 AIA Engineering Ltd (Industrials)
Equity, Since 28 Feb 21 | AIAENG3% ₹258 Cr 572,697 HDFC Bank Ltd (Financial Services)
Equity, Since 31 Jan 22 | HDFCBANK3% ₹250 Cr 3,357,506
↑ 1,057,506 Container Corporation of India Ltd (Industrials)
Equity, Since 31 Jan 16 | CONCOR3% ₹227 Cr 4,885,153 4. LIC MF Infrastructure Fund
LIC MF Infrastructure Fund
Growth Launch Date 29 Feb 08 NAV (24 Jul 26) ₹53.4108 ↓ -0.10 (-0.20 %) Net Assets (Cr) ₹1,137 on 30 Jun 26 Category Equity - Sectoral AMC LIC Mutual Fund Asset Mgmt Co Ltd Rating Risk High Expense Ratio 2.21 Sharpe Ratio 0.22 Information Ratio 0.58 Alpha Ratio 8.41 Min Investment 5,000 Min SIP Investment 1,000 Exit Load 0-1 Years (1%),1 Years and above(NIL) Growth of 10,000 investment over the years.
Date Value 30 Jun 21 ₹10,000 30 Jun 22 ₹11,137 30 Jun 23 ₹14,179 30 Jun 24 ₹26,268 30 Jun 25 ₹26,896 30 Jun 26 ₹29,151 Returns for LIC MF Infrastructure Fund
absolute basis & more than 1 year are on CAGR (Compound Annual Growth Rate) basis. as on 23 Jul 26 Duration Returns 1 Month -3.2% 3 Month 4% 6 Month 16.5% 1 Year 5.8% 3 Year 24.5% 5 Year 22.2% 10 Year 15 Year Since launch 9.5% Historical performance (Yearly) on absolute basis
Year Returns 2025 -3.7% 2024 47.8% 2023 44.4% 2022 7.9% 2021 46.6% 2020 -0.1% 2019 13.3% 2018 -14.6% 2017 42.2% 2016 -2.2% Fund Manager information for LIC MF Infrastructure Fund
Name Since Tenure Sumit Bhatnagar 7 Apr 26 0.23 Yr. Mahesh Bendre 1 Jul 24 2 Yr. Data below for LIC MF Infrastructure Fund as on 30 Jun 26
Equity Sector Allocation
Sector Value Industrials 37.05% Consumer Cyclical 20.88% Basic Materials 12.42% Utility 11.88% Communication Services 5.02% Financial Services 3.98% Real Estate 1.97% Health Care 1.89% Technology 1.08% Asset Allocation
Asset Class Value Cash 3.82% Equity 96.18% Top Securities Holdings / Portfolio
Name Holding Value Quantity Larsen & Toubro Ltd (Industrials)
Equity, Since 30 Apr 09 | LT4% ₹44 Cr 106,968
↓ -10,884 Garware Hi-Tech Films Ltd (Basic Materials)
Equity, Since 31 Aug 23 | 5006554% ₹40 Cr 65,325
↓ -7,684 Tata Motors Passenger Vehicles Ltd (Consumer Cyclical)
Equity, Since 28 Feb 26 | TMPV4% ₹39 Cr 982,891
↓ -332,760 Tata Motors Ltd (Consumer Cyclical)
Equity, Since 31 Oct 25 | TMCV4% ₹39 Cr 1,015,933
↑ 26,983 Tata Power Co Ltd (Utilities)
Equity, Since 29 Feb 24 | TATAPOWER3% ₹36 Cr 861,040
↑ 524,312 KSH International Ltd (Industrials)
Equity, Since 31 Dec 25 | KSHINTL3% ₹34 Cr 432,816
↑ 6,280 Siemens Energy India Ltd (Utilities)
Equity, Since 31 Aug 25 | ENRIN3% ₹34 Cr 87,106
↑ 24,800 JSW Infrastructure Ltd (Industrials)
Equity, Since 30 Apr 26 | JSWINFRA3% ₹31 Cr 1,133,858
↑ 745,681 Carraro India Ltd (Consumer Cyclical)
Equity, Since 31 Dec 24 | CARRARO3% ₹31 Cr 572,991 Bharat Dynamics Ltd Ordinary Shares (Industrials)
Equity, Since 31 Jan 26 | BDL3% ₹29 Cr 242,954
↑ 157,744 5. Nippon India Power and Infra Fund
Nippon India Power and Infra Fund
Growth Launch Date 8 May 04 NAV (24 Jul 26) ₹376.558 ↓ -0.45 (-0.12 %) Net Assets (Cr) ₹8,043 on 30 Jun 26 Category Equity - Sectoral AMC Nippon Life Asset Management Ltd. Rating ☆☆☆☆ Risk High Expense Ratio 1.85 Sharpe Ratio 0.24 Information Ratio 0.56 Alpha Ratio 8.81 Min Investment 5,000 Min SIP Investment 100 Exit Load 0-1 Years (1%),1 Years and above(NIL) Growth of 10,000 investment over the years.
Date Value 30 Jun 21 ₹10,000 30 Jun 22 ₹10,223 30 Jun 23 ₹15,004 30 Jun 24 ₹27,370 30 Jun 25 ₹26,049 30 Jun 26 ₹28,381 Returns for Nippon India Power and Infra Fund
absolute basis & more than 1 year are on CAGR (Compound Annual Growth Rate) basis. as on 23 Jul 26 Duration Returns 1 Month -2.5% 3 Month 0.8% 6 Month 17.2% 1 Year 8.6% 3 Year 20.6% 5 Year 21.7% 10 Year 15 Year Since launch 17.7% Historical performance (Yearly) on absolute basis
Year Returns 2025 -0.5% 2024 26.9% 2023 58% 2022 10.9% 2021 48.9% 2020 10.8% 2019 -2.9% 2018 -21.1% 2017 61.7% 2016 0.1% Fund Manager information for Nippon India Power and Infra Fund
Name Since Tenure Kinjal Desai 25 May 18 8.11 Yr. Rahul Modi 19 Aug 24 1.87 Yr. Amber Singhania 11 Mar 26 0.31 Yr. Data below for Nippon India Power and Infra Fund as on 30 Jun 26
Equity Sector Allocation
Sector Value Industrials 34.92% Utility 22.36% Consumer Cyclical 11.45% Energy 9.18% Basic Materials 6.78% Technology 4.51% Financial Services 4.09% Communication Services 2.39% Real Estate 1.47% Health Care 1.24% Asset Allocation
Asset Class Value Cash 1.59% Equity 98.41% Top Securities Holdings / Portfolio
Name Holding Value Quantity Reliance Industries Ltd (Energy)
Equity, Since 30 Nov 18 | RELIANCE8% ₹616 Cr 4,660,000 Larsen & Toubro Ltd (Industrials)
Equity, Since 30 Nov 07 | LT7% ₹557 Cr 1,366,958
↑ 20,000 NTPC Ltd (Utilities)
Equity, Since 31 May 09 | NTPC6% ₹487 Cr 12,600,000
↓ -554,060 NTPC Green Energy Ltd (Utilities)
Equity, Since 30 Nov 24 | NTPCGREEN4% ₹296 Cr 28,594,584
↑ 2,403,505 Tata Power Co Ltd (Utilities)
Equity, Since 30 Apr 23 | TATAPOWER3% ₹246 Cr 5,850,789
↓ -100,000 Bharat Heavy Electricals Ltd (Industrials)
Equity, Since 30 Sep 24 | BHEL3% ₹242 Cr 5,800,000
↓ -1,148,468 Triveni Turbine Ltd (Industrials)
Equity, Since 30 Jun 25 | TRITURBINE3% ₹237 Cr 3,193,288
↑ 120,000 Power Finance Corp Ltd (Financial Services)
Equity, Since 31 Oct 24 | PFC3% ₹198 Cr 4,620,000
↑ 720,000 Bharti Airtel Ltd (Communication Services)
Equity, Since 30 Apr 18 | BHARTIARTL2% ₹188 Cr 1,030,000
↑ 180,000 CG Power & Industrial Solutions Ltd (Industrials)
Equity, Since 30 Sep 24 | CGPOWER2% ₹174 Cr 1,893,400
↓ -276,614 6. DSP India T.I.G.E.R Fund
DSP India T.I.G.E.R Fund
Growth Launch Date 11 Jun 04 NAV (24 Jul 26) ₹356.825 ↓ -0.65 (-0.18 %) Net Assets (Cr) ₹6,264 on 30 Jun 26 Category Equity - Sectoral AMC DSP BlackRock Invmt Managers Pvt. Ltd. Rating ☆☆☆☆ Risk High Expense Ratio 1.89 Sharpe Ratio 0.44 Information Ratio 0 Alpha Ratio 0 Min Investment 1,000 Min SIP Investment 500 Exit Load 0-12 Months (1%),12 Months and above(NIL) Growth of 10,000 investment over the years.
Date Value 30 Jun 21 ₹10,000 30 Jun 22 ₹10,551 30 Jun 23 ₹14,508 30 Jun 24 ₹25,980 30 Jun 25 ₹25,049 30 Jun 26 ₹28,384 Returns for DSP India T.I.G.E.R Fund
absolute basis & more than 1 year are on CAGR (Compound Annual Growth Rate) basis. as on 23 Jul 26 Duration Returns 1 Month -1.9% 3 Month 4.9% 6 Month 20.1% 1 Year 12.6% 3 Year 22.4% 5 Year 21.7% 10 Year 15 Year Since launch 17.5% Historical performance (Yearly) on absolute basis
Year Returns 2025 -2.5% 2024 32.4% 2023 49% 2022 13.9% 2021 51.6% 2020 2.7% 2019 6.7% 2018 -17.2% 2017 47% 2016 4.1% Fund Manager information for DSP India T.I.G.E.R Fund
Name Since Tenure Rohit Singhania 21 Jun 10 16.04 Yr. Data below for DSP India T.I.G.E.R Fund as on 30 Jun 26
Equity Sector Allocation
Sector Value Industrials 28.69% Basic Materials 13.29% Energy 9.47% Utility 9.46% Financial Services 8.49% Consumer Cyclical 6.52% Health Care 6.13% Communication Services 2.58% Technology 1.52% Real Estate 1.49% Consumer Defensive 0.71% Asset Allocation
Asset Class Value Cash 11.66% Equity 88.34% Top Securities Holdings / Portfolio
Name Holding Value Quantity Reliance Industries Ltd (Energy)
Equity, Since 31 Aug 19 | RELIANCE4% ₹262 Cr 1,983,815
↑ 1,304,235 NTPC Ltd (Utilities)
Equity, Since 30 Nov 17 | NTPC4% ₹249 Cr 6,433,748
↓ -94,844 Apollo Hospitals Enterprise Ltd (Healthcare)
Equity, Since 31 Dec 24 | APOLLOHOSP4% ₹247 Cr 301,630 Larsen & Toubro Ltd (Industrials)
Equity, Since 30 Jun 04 | LT4% ₹240 Cr 588,665 Kirloskar Oil Engines Ltd (Industrials)
Equity, Since 31 Mar 23 | 5332933% ₹161 Cr 834,973 Bharti Airtel Ltd (Communication Services)
Equity, Since 31 Oct 18 | BHARTIARTL3% ₹155 Cr 849,969 Coal India Ltd (Energy)
Equity, Since 31 Dec 23 | COALINDIA3% ₹154 Cr 3,352,298
↑ 647,118 INOX India Ltd (Industrials)
Equity, Since 31 Dec 23 | INOXINDIA2% ₹139 Cr 931,429
↓ -9,412 UltraTech Cement Ltd (Basic Materials)
Equity, Since 31 Dec 14 | ULTRACEMCO2% ₹135 Cr 118,010
↑ 51,464 Hindustan Aeronautics Ltd Ordinary Shares (Industrials)
Equity, Since 31 Oct 25 | HAL2% ₹131 Cr 305,098 7. Invesco India PSU Equity Fund
Invesco India PSU Equity Fund
Growth Launch Date 18 Nov 09 NAV (24 Jul 26) ₹64.09 ↓ -0.13 (-0.20 %) Net Assets (Cr) ₹1,473 on 30 Jun 26 Category Equity - Sectoral AMC Invesco Asset Management (India) Private Ltd Rating ☆☆☆ Risk High Expense Ratio 2.14 Sharpe Ratio -0.16 Information Ratio -0.57 Alpha Ratio -6.88 Min Investment 5,000 Min SIP Investment 500 Exit Load 0-1 Years (1%),1 Years and above(NIL) Growth of 10,000 investment over the years.
Date Value 30 Jun 21 ₹10,000 30 Jun 22 ₹9,722 30 Jun 23 ₹13,891 30 Jun 24 ₹27,099 30 Jun 25 ₹26,286 30 Jun 26 ₹26,262 Returns for Invesco India PSU Equity Fund
absolute basis & more than 1 year are on CAGR (Compound Annual Growth Rate) basis. as on 23 Jul 26 Duration Returns 1 Month -3.1% 3 Month -6.1% 6 Month -1.4% 1 Year -0.3% 3 Year 20.4% 5 Year 20.6% 10 Year 15 Year Since launch 11.8% Historical performance (Yearly) on absolute basis
Year Returns 2025 10.3% 2024 25.6% 2023 54.5% 2022 20.5% 2021 31.1% 2020 6.1% 2019 10.1% 2018 -16.9% 2017 24.3% 2016 17.9% Fund Manager information for Invesco India PSU Equity Fund
Name Since Tenure Hiten Jain 1 Jul 25 1 Yr. Sagar Gandhi 1 Jul 25 1 Yr. Data below for Invesco India PSU Equity Fund as on 30 Jun 26
Equity Sector Allocation
Sector Value Financial Services 30.26% Industrials 29.89% Utility 19.1% Energy 13.91% Basic Materials 3.59% Consumer Cyclical 1.59% Asset Allocation
Asset Class Value Cash 1.66% Equity 98.34% Top Securities Holdings / Portfolio
Name Holding Value Quantity State Bank of India (Financial Services)
Equity, Since 28 Feb 21 | SBIN9% ₹128 Cr 1,323,094
↑ 151,862 Hindustan Aeronautics Ltd Ordinary Shares (Industrials)
Equity, Since 31 May 22 | HAL8% ₹112 Cr 261,137 Indian Bank (Financial Services)
Equity, Since 30 Jun 21 | INDIANB8% ₹112 Cr 1,341,970
↑ 78,651 Bharat Petroleum Corp Ltd (Energy)
Equity, Since 30 Sep 18 | BPCL6% ₹92 Cr 3,076,024 Bharat Electronics Ltd (Industrials)
Equity, Since 31 Mar 17 | BEL6% ₹85 Cr 2,078,629 Dredging Corp of India Ltd (Industrials)
Equity, Since 31 Jul 25 | DREDGECORP5% ₹75 Cr 646,300 NTPC Green Energy Ltd (Utilities)
Equity, Since 30 Nov 24 | NTPCGREEN5% ₹71 Cr 6,852,914 Bank of Baroda (Financial Services)
Equity, Since 30 Jun 21 | BANKBARODA5% ₹70 Cr 2,611,219 NTPC Ltd (Utilities)
Equity, Since 31 May 19 | NTPC5% ₹70 Cr 1,801,543 REC Ltd (Financial Services)
Equity, Since 31 Aug 23 | RECLTD4% ₹58 Cr 1,703,577 8. BOI AXA Manufacturing and Infrastructure Fund
BOI AXA Manufacturing and Infrastructure Fund
Growth Launch Date 5 Mar 10 NAV (24 Jul 26) ₹65.94 ↓ -0.02 (-0.03 %) Net Assets (Cr) ₹837 on 30 Jun 26 Category Equity - Sectoral AMC BOI AXA Investment Mngrs Private Ltd Rating Risk High Expense Ratio 2.4 Sharpe Ratio 0.53 Information Ratio 0 Alpha Ratio 0 Min Investment 5,000 Min SIP Investment 1,000 Exit Load 0-1 Years (1%),1 Years and above(NIL) Growth of 10,000 investment over the years.
Date Value 30 Jun 21 ₹10,000 30 Jun 22 ₹10,067 30 Jun 23 ₹13,588 30 Jun 24 ₹22,409 30 Jun 25 ₹22,619 30 Jun 26 ₹25,882 Returns for BOI AXA Manufacturing and Infrastructure Fund
absolute basis & more than 1 year are on CAGR (Compound Annual Growth Rate) basis. as on 23 Jul 26 Duration Returns 1 Month 0.8% 3 Month 7.4% 6 Month 18.4% 1 Year 14.6% 3 Year 23% 5 Year 20.2% 10 Year 15 Year Since launch 12.2% Historical performance (Yearly) on absolute basis
Year Returns 2025 7.8% 2024 25.7% 2023 44.7% 2022 3.3% 2021 52.5% 2020 28.1% 2019 2.5% 2018 -22.8% 2017 56% 2016 1% Fund Manager information for BOI AXA Manufacturing and Infrastructure Fund
Name Since Tenure Nitin Gosar 27 Sep 22 3.76 Yr. Data below for BOI AXA Manufacturing and Infrastructure Fund as on 30 Jun 26
Equity Sector Allocation
Sector Value Industrials 24.81% Basic Materials 13.14% Consumer Cyclical 12.85% Health Care 11.87% Energy 10.92% Utility 6.13% Communication Services 4.02% Technology 3.57% Consumer Defensive 3.15% Real Estate 1.14% Asset Allocation
Asset Class Value Cash 6.24% Equity 93.66% Debt 0.1% Top Securities Holdings / Portfolio
Name Holding Value Quantity Larsen & Toubro Ltd (Industrials)
Equity, Since 31 Mar 10 | LT7% ₹52 Cr 127,443
↓ -23,672 NTPC Ltd (Utilities)
Equity, Since 31 May 21 | NTPC6% ₹48 Cr 1,250,367 Reliance Industries Ltd (Energy)
Equity, Since 31 Oct 20 | RELIANCE6% ₹47 Cr 356,510 Bharti Airtel Ltd (Communication Services)
Equity, Since 31 Dec 22 | BHARTIARTL4% ₹32 Cr 173,416 Dixon Technologies (India) Ltd (Technology)
Equity, Since 30 Apr 26 | DIXON4% ₹28 Cr 24,451
↑ 8,155 Aurobindo Pharma Ltd (Healthcare)
Equity, Since 31 May 25 | AUROPHARMA4% ₹28 Cr 196,331 Cemindia Projects Ltd (Industrials)
Equity, Since 31 Dec 22 | CEMPRO3% ₹26 Cr 243,152
↓ -65,994 Petronet LNG Ltd (Energy)
Equity, Since 31 Jan 26 | PETRONET3% ₹25 Cr 931,486
↑ 138,246 Stylam Industries Ltd (Consumer Cyclical)
Equity, Since 30 Apr 25 | 5269513% ₹24 Cr 83,372 Lloyds Metals & Energy Ltd (Basic Materials)
Equity, Since 30 Nov 24 | 5124553% ₹23 Cr 130,000
↓ -53,702 9. Canara Robeco Infrastructure
Canara Robeco Infrastructure
Growth Launch Date 2 Dec 05 NAV (24 Jul 26) ₹166.11 ↓ -0.64 (-0.38 %) Net Assets (Cr) ₹998 on 30 Jun 26 Category Equity - Sectoral AMC Canara Robeco Asset Management Co. Ltd. Rating Risk High Expense Ratio 2.32 Sharpe Ratio 0.02 Information Ratio 0 Alpha Ratio 0 Min Investment 5,000 Min SIP Investment 1,000 Exit Load 0-1 Years (1%),1 Years and above(NIL) Growth of 10,000 investment over the years.
Date Value 30 Jun 21 ₹10,000 30 Jun 22 ₹10,964 30 Jun 23 ₹14,661 30 Jun 24 ₹25,325 30 Jun 25 ₹25,500 30 Jun 26 ₹26,666 Returns for Canara Robeco Infrastructure
absolute basis & more than 1 year are on CAGR (Compound Annual Growth Rate) basis. as on 23 Jul 26 Duration Returns 1 Month -3.1% 3 Month -2.8% 6 Month 11.3% 1 Year 2.6% 3 Year 20% 5 Year 19.6% 10 Year 15 Year Since launch 14.6% Historical performance (Yearly) on absolute basis
Year Returns 2025 0.1% 2024 35.3% 2023 41.2% 2022 9% 2021 56.1% 2020 9% 2019 2.3% 2018 -19.1% 2017 40.2% 2016 2.1% Fund Manager information for Canara Robeco Infrastructure
Name Since Tenure Vishal Mishra 26 Jun 21 5.01 Yr. Shridatta Bhandwaldar 29 Sep 18 7.76 Yr. Data below for Canara Robeco Infrastructure as on 30 Jun 26
Equity Sector Allocation
Sector Value Industrials 46.53% Utility 12.52% Basic Materials 11.01% Energy 7.46% Financial Services 6.8% Communication Services 3.99% Technology 3.66% Consumer Cyclical 2.25% Real Estate 0.9% Asset Allocation
Asset Class Value Cash 4.86% Equity 95.14% Top Securities Holdings / Portfolio
Name Holding Value Quantity Larsen & Toubro Ltd (Industrials)
Equity, Since 28 Feb 11 | LT10% ₹99 Cr 242,151
↑ 9,250 Reliance Industries Ltd (Energy)
Equity, Since 30 Apr 22 | RELIANCE5% ₹49 Cr 373,750
↑ 60,000 CG Power & Industrial Solutions Ltd (Industrials)
Equity, Since 31 Oct 23 | CGPOWER5% ₹48 Cr 525,650 NTPC Ltd (Utilities)
Equity, Since 30 Nov 18 | NTPC4% ₹41 Cr 1,066,480 Bharti Airtel Ltd (Communication Services)
Equity, Since 31 May 24 | BHARTIARTL4% ₹40 Cr 216,600
↑ 55,000 State Bank of India (Financial Services)
Equity, Since 31 Jul 24 | SBIN4% ₹39 Cr 406,500
↑ 20,000 Bharat Electronics Ltd (Industrials)
Equity, Since 31 Jul 19 | BEL4% ₹38 Cr 929,000
↑ 60,000 Tata Power Co Ltd (Utilities)
Equity, Since 30 Sep 24 | TATAPOWER4% ₹37 Cr 870,000 Cummins India Ltd (Industrials)
Equity, Since 31 Jul 24 | CUMMINSIND3% ₹33 Cr 56,000
↓ -2,500 InterGlobe Aviation Ltd (Industrials)
Equity, Since 31 Jan 23 | INDIGO3% ₹31 Cr 70,000
↑ 6,000 10. Franklin Build India Fund
Franklin Build India Fund
Growth Launch Date 4 Sep 09 NAV (24 Jul 26) ₹142.088 ↓ -0.63 (-0.44 %) Net Assets (Cr) ₹3,256 on 30 Jun 26 Category Equity - Sectoral AMC Franklin Templeton Asst Mgmt(IND)Pvt Ltd Rating ☆☆☆☆☆ Risk High Expense Ratio 2.01 Sharpe Ratio -0.04 Information Ratio 0 Alpha Ratio 0 Min Investment 5,000 Min SIP Investment 500 Exit Load 0-1 Years (1%),1 Years and above(NIL) Growth of 10,000 investment over the years.
Date Value 30 Jun 21 ₹10,000 30 Jun 22 ₹10,442 30 Jun 23 ₹14,260 30 Jun 24 ₹25,315 30 Jun 25 ₹25,295 30 Jun 26 ₹26,100 Returns for Franklin Build India Fund
absolute basis & more than 1 year are on CAGR (Compound Annual Growth Rate) basis. as on 23 Jul 26 Duration Returns 1 Month -4.8% 3 Month -3.2% 6 Month 4.3% 1 Year -0.6% 3 Year 18.6% 5 Year 19.2% 10 Year 15 Year Since launch 17% Historical performance (Yearly) on absolute basis
Year Returns 2025 3.7% 2024 27.8% 2023 51.1% 2022 11.2% 2021 45.9% 2020 5.4% 2019 6% 2018 -10.7% 2017 43.3% 2016 8.4% Fund Manager information for Franklin Build India Fund
Name Since Tenure Ajay Argal 18 Oct 21 4.7 Yr. Kiran Sebastian 7 Feb 22 4.4 Yr. Sandeep Manam 18 Oct 21 4.7 Yr. Data below for Franklin Build India Fund as on 30 Jun 26
Equity Sector Allocation
Sector Value Industrials 35.44% Utility 17.21% Financial Services 13.43% Energy 12.44% Basic Materials 6.69% Communication Services 5.26% Real Estate 2.46% Consumer Cyclical 1.21% Technology 1.09% Asset Allocation
Asset Class Value Cash 4.79% Equity 95.21% Top Securities Holdings / Portfolio
Name Holding Value Quantity Larsen & Toubro Ltd (Industrials)
Equity, Since 29 Feb 20 | LT9% ₹296 Cr 725,000
↑ 125,000 InterGlobe Aviation Ltd (Industrials)
Equity, Since 29 Feb 20 | INDIGO6% ₹185 Cr 420,000 Oil & Natural Gas Corp Ltd (Energy)
Equity, Since 30 Jun 19 | ONGC6% ₹181 Cr 6,825,000 NTPC Ltd (Utilities)
Equity, Since 30 Nov 16 | NTPC6% ₹178 Cr 4,600,000 Reliance Industries Ltd (Energy)
Equity, Since 31 Oct 21 | RELIANCE5% ₹172 Cr 1,300,000 Tata Power Co Ltd (Utilities)
Equity, Since 31 Jan 25 | TATAPOWER4% ₹130 Cr 3,100,000
↑ 900,000 Bharti Airtel Ltd (Communication Services)
Equity, Since 30 Sep 09 | BHARTIARTL4% ₹130 Cr 710,000 Axis Bank Ltd (Financial Services)
Equity, Since 31 Mar 12 | AXISBANK4% ₹129 Cr 1,000,000 Power Grid Corp Of India Ltd (Utilities)
Equity, Since 28 Feb 21 | POWERGRID4% ₹126 Cr 4,350,000 HDFC Bank Ltd (Financial Services)
Equity, Since 31 Oct 25 | HDFCBANK4% ₹121 Cr 1,625,000 11. HDFC Infrastructure Fund
HDFC Infrastructure Fund
Growth Launch Date 10 Mar 08 NAV (24 Jul 26) ₹46.361 ↓ -0.09 (-0.20 %) Net Assets (Cr) ₹2,444 on 30 Jun 26 Category Equity - Sectoral AMC HDFC Asset Management Company Limited Rating ☆☆☆ Risk High Expense Ratio 2.06 Sharpe Ratio -0.23 Information Ratio 0 Alpha Ratio 0 Min Investment 5,000 Min SIP Investment 300 Exit Load 0-1 Years (1%),1 Years and above(NIL) Growth of 10,000 investment over the years.
Date Value 30 Jun 21 ₹10,000 30 Jun 22 ₹10,473 30 Jun 23 ₹15,020 30 Jun 24 ₹26,406 30 Jun 25 ₹26,604 30 Jun 26 ₹26,418 Returns for HDFC Infrastructure Fund
absolute basis & more than 1 year are on CAGR (Compound Annual Growth Rate) basis. as on 23 Jul 26 Duration Returns 1 Month -4.1% 3 Month -1.6% 6 Month 2.8% 1 Year -3.9% 3 Year 16.8% 5 Year 19.1% 10 Year 15 Year Since launch Historical performance (Yearly) on absolute basis
Year Returns 2025 2.2% 2024 23% 2023 55.4% 2022 19.3% 2021 43.2% 2020 -7.5% 2019 -3.4% 2018 -29% 2017 43.3% 2016 -1.9% Fund Manager information for HDFC Infrastructure Fund
Name Since Tenure Dhruv Muchhal 22 Jun 23 3.02 Yr. Ashish Shah 1 Nov 25 0.66 Yr. Data below for HDFC Infrastructure Fund as on 30 Jun 26
Equity Sector Allocation
Sector Value Industrials 46.16% Financial Services 13.54% Utility 12.4% Basic Materials 8.64% Energy 6.75% Real Estate 4.21% Communication Services 3.43% Health Care 2.28% Technology 1.45% Consumer Cyclical 0.72% Asset Allocation
Asset Class Value Cash 0.44% Equity 99.56% Top Securities Holdings / Portfolio
Name Holding Value Quantity Larsen & Toubro Ltd (Industrials)
Equity, Since 30 Jun 12 | LT7% ₹172 Cr 421,000 ICICI Bank Ltd (Financial Services)
Equity, Since 31 Oct 09 | ICICIBANK4% ₹106 Cr 845,000
↓ -185,000 Kalpataru Projects International Ltd (Industrials)
Equity, Since 31 Jan 23 | KPIL4% ₹99 Cr 756,994
↓ -21,291 NTPC Ltd (Utilities)
Equity, Since 31 Dec 17 | NTPC4% ₹91 Cr 2,350,000 InterGlobe Aviation Ltd (Industrials)
Equity, Since 31 Dec 21 | INDIGO3% ₹73 Cr 166,369
↑ 10,000 J Kumar Infraprojects Ltd (Industrials)
Equity, Since 31 Oct 15 | JKIL3% ₹70 Cr 1,400,000 Power Grid Corp Of India Ltd (Utilities)
Equity, Since 30 Apr 24 | POWERGRID3% ₹70 Cr 2,400,000 TD Power Systems Ltd (Industrials)
Equity, Since 30 Jun 23 | TDPOWERSYS3% ₹69 Cr 525,000
↓ -25,000 Reliance Industries Ltd (Energy)
Equity, Since 31 May 24 | RELIANCE3% ₹67 Cr 510,000
↓ -20,000 Adani Ports & Special Economic Zone Ltd (Industrials)
Equity, Since 31 Jan 25 | ADANIPORTS3% ₹67 Cr 370,000
نتیجہ
جب سرمایہ کاری کے فیصلے کرنے کی بات آتی ہے، تو یہ ضروری ہے کہ آپ کو دستیاب اختیارات کی ٹھوس سمجھ ہو۔ ETFs اور میوچل فنڈز میں سرمایہ کاری متنوع پورٹ فولیو پیش کر سکتی ہے، لیکن اپنے مالی اہداف کا اندازہ لگانا بہت ضروری ہے،خطرے کی رواداریاور سرمایہ کاری کا کوئی فیصلہ کرنے سے پہلے وقت کا افق۔ مناسب رہنمائی یا پیشہ ورانہ مدد کے بغیر، سرمایہ کاری کی پیچیدہ دنیا میں تشریف لانا مشکل ہو سکتا ہے۔
یہاں فراہم کردہ معلومات کے درست ہونے کو یقینی بنانے کے لیے تمام کوششیں کی گئی ہیں۔ تاہم، ڈیٹا کی درستگی کے حوالے سے کوئی ضمانت نہیں دی جاتی ہے۔ براہ کرم کوئی بھی سرمایہ کاری کرنے سے پہلے اسکیم کی معلومات کے دستاویز کے ساتھ تصدیق کریں۔
You Might Also Like


 ?")


AMFI Registration No. 112358 | CIN: U74999MH2016PTC282153
Shepard Technologies Pvt. Ltd. (with ARN code 112358) makes no warranties or representations, express or implied, on products offered through the platform. It accepts no liability for any damages or losses, however caused, in connection with the use of, or on the reliance of its product or related services. Terms and conditions of the website are applicable.
©2026 Shepard Technologies Private Limited. All Rights Reserved
Research Highlights for DSP World Gold Fund