Table of Contents
Mutual Fund in India
A Mutual Fund is a collective pool (hence the word mutual) of money given by investors with a common objective for purchasing securities (via the fund). The collective pool is formed by the investors in a Mutual Fund, they are regulated in India by the Securities and Exchange Board of India (SEBI).
Those new to finance, planning and investing often hear the term “Mutual Fund (MF)” and ask “What is a Mutual Fund?”, "Which are the best Mutual Funds?", "What are the Types of Mutual Funds", "What are the best Mutual Funds companies?", "How to Invest in Mutual Funds?" etc. MF is becoming an ideal avenue for investors to participate in the debt and equity markets.
In this article, you will clear most of your doubts about Mutual Funds and its industry.
Overview
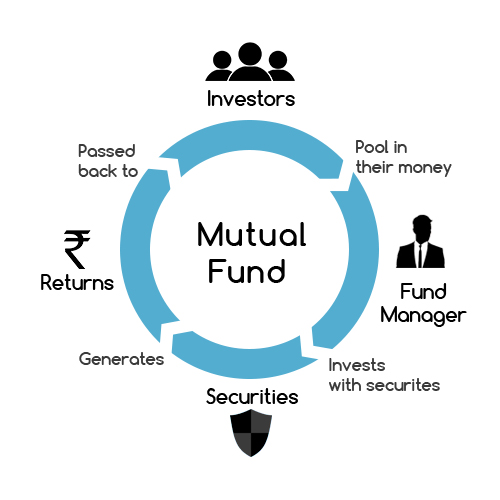
Mutual Funds are a vehicle that collects money from investors to buy securities. These investors have a common objective, and this pool of money is advised by the fund manager who decides how to invest the money. With good fund management, the Mutual Fund Manager (or Portfolio Manager) generates returns for the investors, which are passed back to investors.
Mutual Funds are a regulated industry, there are various rules, guidelines & policies for the MF companies, the fund managers and specifically the funds managed. These regulations are formed by the Securities and Exchange Board of India (SEBI) who is the regulator for Mutual Funds.
Mutual Funds Meaning
As the two words, Mutual connotes getting together and Fund connotes money. Hence by definition, a Mutual Fund is a vehicle for investing money for investors with a common objective. In India, Mutual Funds is a regulated industry with a long history.
Mutual Funds History
Mutual Funds in India came into being in 1963 by an act of parliament. This was done by the government of India with the help of the Reserve Bank of India (RBI). Till 1987, there was no other player in India and it was a monopoly. At that time the industry opened up for the public sector and saw the entry of SBI Mutual Fund. Shortly, other players started coming.
In 1993, the government gave permission the private sector to open up asset management companies. In the next 2 years, 11 more private sector funds came and the year 1996 marked another era with SEBI and the Association of Mutual Funds (AMFI).
AMFI was formed to develop the Indian industry and setup minimum standards.
Mutual Funds Sahi Hai
mutual fund sahi hai is the recently launched campaign by AMFI (Association of Mutual Funds in India) to create investor awareness on Mutual Funds. This campaign is across various media such as TV, newspaper, radio and across the web too. The campaign is not only in English but also across various vernaculars languages. The aim of the Mutual Funds Sahi Hai campaign is to educate people on the various aspects of the industry and increase the penetration of Mutual Funds.
Mutual Funds Investment
Mutual funds offer investors a route to save money and earn returns over time. One can invest in a lump sum or a fixed amount monthly, more commonly known as a systematic investment plan (SIP). Using a lump sum or SIPs, they inculcate the habit of savings. Investors can start Mutual Fund investments with amounts as low as INR 5000 and in the case of SIPs as low as INR 500. There are various mutual fund calculators, available which help first-time investors decide what amount to start off with. These mutual fund calculators help investors kick-start investments.
Systematic Investment
Mutual Funds offer a route called the "Systematic Investment Plan (SIP)" where investors can choose to put in a fixed amount of money every month in a scheme. SIPs are a very convenient way for investors as it's automated.
Systematic investing offers many benefits such as rupee cost averaging, power of compounding, low investment amount, etc.
Mutual Fund Returns
5 Year Returns Across Categories
| Category: Equity | 5 Year Return | Category: Debt | 5 Year Return | Category: Hybrid | 5 Year Return | Category: Commodities | 5 Year Return |
|---|---|---|---|---|---|---|---|
| Large Cap | 14.59 | Long Duration | 5.94 | Aggressive Hybrid | 12.04 | Gold | 9.01 |
| Large & MidCap | 14.42 | Medium to Long Duration | 5.26 | Balanced Hybrid | 7.9 | Silver | - |
| Flexi Cap | 14.38 | Medium Duration | 5.51 | Conservative Hybrid | 6.81 | - | - |
| Multi Cap | -- | Short Duration | 5.79 | Equity Savings | 7.89 | - | - |
| Mid Cap | 15.29 | Low Duration | 5.16 | Arbitrage | 4.91 | - | - |
| Small Cap | 17.47 | Ultra Short Duration | 5.41 | Dynamic Asset Allocation | 8.81 | - | - |
| Value Oriented | 13.68 | Liquid | 5.36 | Multi Asset Allocation | 9.47 | - | - |
| ELSS | 14.4 | Money Market | 6.07 | - | - | - | - |
| Banking | 10.26 | Overnight | 4.6 | - | - | - | - |
| Infrastructure | 12.88 | Dynamic Bond | 5.58 | - | - | - | - |
| Pharma | 12.97 | Corporate Bond | 6.64 | - | - | - | - |
| Technology | 29.78 | Credit Risk | 3.31 | - | - | - | - |
| Thematic | 12.89 | Banking and PSU | 6.9 | - | - | - | - |
| Consumption | 14.63 | Floater | 6.67 | - | - | - | - |
| Dividend Yield | 14 | FMP | 5.04 | - | - | - | - |
| Energy | 15.15 | Gilt | 5.91 | - | - | - | |
| ESG | 14.84 | Gilt with 10 year Constant Duration | 6.71 | - | - | - | - |
| MNC | 11.88 | - | - | - | - | - | - |
| PSU | 4.85 | - | - | - | - | - | - |
| International | 10.79 | - | - | - | - | - | - |
(Returns As on 07-Feb-2022)
Mutual Funds over the last few decades have been a phenomenal vehicle for generating returns for retail investors. The above table gives an idea of returns across the various categories of Mutual Funds.
Talk to our investment specialist
Types Of Mutual Funds
1. Equity Funds
Equity Mutual Funds can be the Large cap funds, mid cap funds, small cap funds, or multi-cap, these are for investors wanting to take exposure to the equity markets. As the name goes, Equity Funds invest in the equity markets. There are specialist fund managers who specialise in stock selection. They try and select the best stocks for their funds, given the Mutual Fund investment mandate. SEBI has set 1- distinct categories for equity funds.
Large Cap Equity Fund
Large-cap funds invest in large-cap companies which are big sized companies with large balance sheets, big teams and a clear organisation structure in place. The exposure in large-cap stocks has to be a minimum 80 percent of the scheme’s total assets.
Mid Cap Fund
Mid-cap funds, on the other hand, invest in smaller-sized companies, these are the emerging stars in their sector and have a potential for growth. Being small in size, these mid-cap companies are very nimble footed and can make changes to product & strategy very quickly. Given this, mid-cap investing brings in a larger risk also. The scheme will invest 65 percent of its total assets in mid-cap stocks.
Large and Mid Cap Fund
These are the schemes that invest in both large & mid cap stocks. These funds will invest a minimum of 35 percent each in mid and large cap stocks.
SEBI has set a clear classification as to what is a large cap, mid cap and small cap:
| Market Capitalization | Description |
|---|---|
| Large cap company | 1st to 100th company in terms of full market capitalization |
| Mid cap company | 101st to 250th company in terms of full market capitalization |
| Small cap company | 251st company onwards in terms of full market capitalization |
Multi Cap Equity Fund
In multi-cap funds, the fund manager invests across the board in large-caps and mid-caps without any restriction (the only restriction being the fund mandate). A minimum of 65 percent of its total assets should be allocated to equities.
Equity Linked Savings Scheme
Equity Linked Savings Schemes (ELSS) is a tax saving fund that comes with a lock-in period of three years. A minimum of 80 percent of its total assets has to be invested in equities.
Dividend Yield Fund
This fund will predominantly invest in dividend yielding stocks. This scheme will invest a minimum 65 percent of its total assets in equities, but in dividend yielding stocks.
Value Fund
This is an equity fund that will follow the value investment strategy.
Contra Fund
This equity scheme will follow the contrarian investment strategy. Value/Contra will invest at least 65 percent of its total assets in equities, but a Mutual Fund house can either offer a value fund or a contra fund, but not both.
Focused Fund
This fund will focus on large, mid, small or multi-cap stocks, but can have a maximum of 30 stocks. focused fund can invest at least 65 percent of its total assets in equities.
Sector/Thematic Fund
These are the funds that invest in a particular sector or a theme. At least 80 percent of the total assets of these schemes will be invested in a particular sector or theme.
2. Debt Funds
There are various kinds of debt funds that exist in the Indian markets. These funds invest in various debt & money market instruments such as government securities (G-Secs), commercial papers (CPs), certificate of deposits (CDs) and other instruments. As per SEBI’s new categorization, Debt fund schemes will have 16 categories. Here’s the list:
Overnight Fund
This debt scheme will invest in overnight securities having a maturity of one day.
Liquid Fund
These are very "liquid" as the name goes. These are the funds that in most cases would try to generate returns for investors even he/she invests for one day! As per regulations, Liquid Funds invest in debt/money market securities with a maturity of less than 91 days. These are apt for investors looking to park their money for a couple of days. These funds typically don't have any exit load.
Ultra Short Duration Fund
On the risk scale, these funds have a risk that is slightly above that of liquid funds. Ultra short term funds invest in debt securities with a slightly higher maturity than liquid funds. These types of Mutual funds can give a minor loss in a day if there is a very sharp upward movement in interest rates. However, these are great for investors looking to invest money between three months to six months. Most ultra short term funds don't have any exit load, even if they do, it is for a week to a fortnight at best.
Low Duration Fund
Low duration debt securities come with a slightly higher maturity than ultra short funds. The scheme will invest in debt and money market securities with a Macaulay duration between six to 12 months.
Money Market Fund
This scheme will invest in money market instruments such as CDs, CPs, T-Bills having a maturity up to one year.
Short Term Fund
Short term Mutual Funds are great for investors looking to invest for a year or more. These also invest in debt securities and do take a little bit of interest rate risk. If interest rates move downwards then there will be capital appreciation on the portfolio along with the return earned due to interest. These funds invest in debt and money market instruments with a Macaulay duration of one to three years.
Medium Duration Fund
This scheme will invest in debt and money market instruments with a Macaulay duration of three to four years.
Medium to Long Duration Fund
This scheme will invest in debt and money market instruments with a Macaulay duration of four to seven years.
Long Duration Fund
This scheme will invest in debt and money market instruments with a Macaulay duration greater than seven years.
Dynamic Bond Fund
A dynamic bond fund is a mutual fund scheme that invests its funds in fixed income securities consisting of varying maturity periods, which means that they invest across all the duration. Here, the fund manager decides on which funds they need to invest based on their perception of the interest rate scenario and future interest rate movements. Based on this decision, they invest in funds across various maturity periods of debt instruments. This mutual fund scheme is suitable for individuals who feel puzzled about the interest rate scenario. Such individuals can rely on the view of the fund managers to earn money through dynamic bonds funds.
Corporate Bond Fund
Corporate bond funds are essentially a certificate of debt issued by major companies. These are issued as a way of raising money for businesses. Corporate bond funds are a great option when it comes to good return and low-risk type investment. This debt scheme mainly invests in the highest rated corporate bonds. The fund can invest a minimum 80 percent of its total assets in the highest-rated corporate bonds.
Credit Risk Fund
This scheme will invest in below the high-rated corporate bonds. The credit risk fund should invest at least 65 percent of its assets below the highest-rated instruments.
Banking and PUS Fund
This scheme predominantly invests in debt instruments of Banks, Public Financial Institutional, Public Sector Undertakings.
Gilt Fund
This funds invest in government securities. The maturity of the funds various as per the mandate of the fund. And so does the risk in the fund. Gilt funds are usually used as an avenue to invest by seasoned investors who know what they are doing and are clear on interest rate movements. The higher the duration or maturity of the gilt fund, higher the risk. This funds will invest a minimum 80 percent of its total assets in government securities.
Gilt Fund with 10-year Constant Duration
This scheme will invest in government securities with a maturity of 10 years. Gilt Funds with 10-year Constant Duration will invest a minimum 80 percent in government securities.
Floater Fund
This debt scheme mainly invests in floating rate instruments. Floater Fund will invest a minimum of 65 percent of its total assets in floating rate instruments.
3. Hybrid Funds
For the investors in the middle who want to be on the fence, there are balanced funds or hybrid funds. According to the new SEBI’s regulation, there will be six categories of Hybrid Funds:
Conservative Hybrid Fund
Hybrid Funds are also commonly known as Balanced Fund. Hybrid funds are a type of Mutual Funds that invest in both equity and debt mutual fund. In other words, this fund acts as a combination of both debt and equity. The conservative hybrid funds will majorly invested in debt instruments. About 75 to 90 percent of their total assets will be invest in debt instruments and about 10 to 25 percent in equity-related instruments. Hybrid funds are a great option for the investors who fear of investing in equity funds. This fund will reduce the risk portion and also help in gaining optimal returns over the time.
Balanced Hybrid Fund
This fund will invest around 40-60 percent of its total assets in both debt and equity instruments.
Aggressive Hybrid Fund
This fund will invest around 65 to 85 percent of its total assets in equity-related instruments and about 20 to 35 percent of their assets in debt instruments. Mutual Fund Houses can offer either a balanced hybrid or an aggressive hybrid fund, not both.
Dynamic Asset Allocation or Balanced Advantage Fund
This scheme would dynamically manage their investments in equity and debt instruments.
Multi Asset Allocation
This scheme can invest in three asset classes, which means that they can invest in an extra asset class apart from equity and debt. The fund should invest at least 10 percent in each of the asset classes. Foreign securities will not be treated as a separate asset class.
Arbitrage Fund
An arbitrage fund is a popular short-term financial investment in India. Arbitrage funds are Mutual Funds that leverage the differential price between the cash market and derivative market to generate mutual fund returns. The returns generated by arbitrage funds are dependent on the volatility of the stock market. Arbitrage mutual funds are hybrid in nature and in times of high or persistent volatility, these funds offer relatively risk-free returns to investors. This fund invest at least 65 percent of its assets in equity-related instruments.
Equity Savings
This scheme will invest in equity, arbitrage and debt. Equity savings will invest at least 65 percent of the total assets in stocks and a minimum 10 percent in debt. The scheme would state the minimum hedged and unhedged investments in the scheme information document.
4. Solution Oriented Schemes
Retirement Fund
This is a retirement solution oriented scheme that will have a lock-in of five years or till the age of retirement.
Children’s Fund
This is children oriented scheme having a lock-on for five years or until the child attains the age of majority, whichever is earlier.
5. Other Schemes
Index Fund/ETF
Index Funds refer to the Mutual Fund schemes whose portfolio is constructed using a market index as a base. In other words, the performance of an index fund is dependent on the performance of a particular index. These schemes are passively managed. These funds contain shares in the similar proportion as they are in a particular index. In India, many of the schemes use Nifty or Sensex as the base to construct their portfolio. For example, if the Nifty portfolio constitutes of SBI shares whose proportion is 12% then; the Nifty Index fund will also have 12% equity shares. This fund can invest at least 95 percent of its total asset in securities of a particular index.
FoFs (Overseas Domestic)
Fund of funds is an option for those whose investment amounts are not too large and it is easier to manage one fund (a fund of funds) rather than a number of Mutual Funds. In this form of mutual fund investment strategy, investors get to hold a number of funds under the umbrella of a single fund, hence the name funds of funds. Often going by the name of multi-manager investment; it is considered as one of the mutual fund categories. One of the key advantages of multi-manager investments is that at a lower ticket size, the investor can diversify themselves across a gamut of mutual fund schemes. This fund can invest a minimum of 95 percent of its total assets in the underlying fund.
Some of the other Mutual Funds to consider:
International Funds
International Funds invest in international securities or into master funds that are domiciled out of India. Most of these funds invest in equity as an asset class. These can be of various types such as emerging market funds, developed markets funds, commodity-related international funds etc. The DSP Blackrock World Gold Fund is an example of a fund that invests in a master fund based out of India. This fund invests predominantly in gold and other precious metals. Today, there are many international Mutual Funds available in India to the investor.
Gold Funds
Gold funds are a new class of funds. These invest in gold ETFs. While gold ETFs are available to the retail investor, anyone wanting to buy an ETF has to do it through the stock exchange, which requires one to have a broking account. In a Mutual Fund, there is no such requirement, an investor can simply fill an application form and get the units allotted after making the payment.
Best Mutual Funds in India 2025
Investors are always searching for the top mutual funds or best mutual funds to invest in. How to select the best mutual fund is another exercise in itself. One needs to look are various things like the goal for investing, fund house, mutual fund rating and over this follow a disciplined approach. Only then can one try and select the best mutual fund.
Top 10 Equity Mutual Funds
The top 10 equity mutual funds to invest are always something investors try to seek. From the entire list of the funds available in a category getting to the Top 10 Mutual Funds involves doing many activities to filter the list and get the top & Best Performing Mutual Funds. The top 10 equity mutual funds to invest in are:
Fund NAV Net Assets (Cr) 3 MO (%) 6 MO (%) 1 YR (%) 3 YR (%) 5 YR (%) 2024 (%) Principal Emerging Bluechip Fund Growth ₹183.316
↑ 2.03 ₹3,124 2.9 13.6 38.9 21.9 19.2 ICICI Prudential Banking and Financial Services Fund Growth ₹132.5
↓ -0.86 ₹9,375 15.5 6 16.7 21.1 24.2 11.6 Invesco India Growth Opportunities Fund Growth ₹97.96
↓ -0.29 ₹6,765 20.3 -0.5 14.4 28.8 26.1 37.5 Aditya Birla Sun Life Banking And Financial Services Fund Growth ₹60.45
↓ -0.37 ₹3,439 16.6 4.3 12.2 22.3 24.4 8.7 Motilal Oswal Multicap 35 Fund Growth ₹59.9336
↓ -0.15 ₹12,418 11.2 -8.3 11.3 26.8 22.1 45.7 DSP BlackRock US Flexible Equity Fund Growth ₹60.5305
↓ -0.10 ₹765 11.2 3.3 11.2 15.8 16.1 17.8 Mirae Asset India Equity Fund Growth ₹110.695
↓ -0.77 ₹38,892 11.7 -1.3 7.3 16.1 19.9 12.7 Sundaram Rural and Consumption Fund Growth ₹95.1671
↓ -0.53 ₹1,532 10.8 -4.4 6.4 21.5 21.1 20.1 DSP BlackRock Equity Opportunities Fund Growth ₹611.535
↓ -3.69 ₹14,387 12.1 -1.7 6.1 25.1 25.5 23.9 Tata India Tax Savings Fund Growth ₹43.7325
↓ -0.27 ₹4,405 12.4 -4 5.7 20.1 22.6 19.5 Note: Returns up to 1 year are on absolute basis & more than 1 year are on CAGR basis. as on 31 Dec 21
Top Debt 10 Mutual Funds
The top 10 debt mutual funds to invest are always something investors try to seek. From the entire list of the funds available in a category getting to the top 10 mutual funds involves doing many activities to filter the list and get the top & best performing Mutual Funds. The top 10 debt mutual funds to invest in are:
Fund NAV Net Assets (Cr) 3 MO (%) 6 MO (%) 1 YR (%) 3 YR (%) 2024 (%) Debt Yield (YTM) Mod. Duration Eff. Maturity ICICI Prudential Long Term Plan Growth ₹36.9856
↓ -0.01 ₹14,635 3.2 4.9 9.5 8.7 8.2 7.32% 4Y 1M 17D 8Y 6M 11D HDFC Corporate Bond Fund Growth ₹32.5809
↓ -0.04 ₹32,657 3.4 4.8 9.5 8.1 8.6 7.05% 4Y 2M 19D 6Y 4M 20D Aditya Birla Sun Life Corporate Bond Fund Growth ₹112.985
↓ -0.10 ₹25,884 3.2 4.7 9.4 8.1 8.5 7.03% 3Y 7M 28D 5Y 2M 12D HDFC Banking and PSU Debt Fund Growth ₹23.0409
↓ -0.03 ₹6,007 3.4 4.9 9.2 7.5 7.9 6.93% 3Y 11M 1D 5Y 6M 18D Aditya Birla Sun Life Money Manager Fund Growth ₹369.759
↑ 0.03 ₹27,171 2.5 4.3 8.1 7.5 7.8 6.91% 7M 24D 7M 24D Aditya Birla Sun Life Savings Fund Growth ₹547.255
↑ 0.03 ₹17,263 2.4 4.2 8.1 7.3 7.9 7.27% 5M 16D 6M 14D Principal Cash Management Fund Growth ₹2,297.19
↑ 0.25 ₹5,708 1.8 3.5 7.2 6.9 7.3 6.54% 1M 10D 1M 9D JM Liquid Fund Growth ₹71.0635
↑ 0.01 ₹2,680 1.8 3.5 7.1 6.9 7.2 6.46% 1M 10D 1M 13D Aditya Birla Sun Life Medium Term Plan Growth ₹39.8192
↓ -0.03 ₹2,338 3.5 7.3 13.8 14.9 10.5 7.68% 3Y 7M 6D 4Y 9M 29D SBI Magnum Constant Maturity Fund Growth ₹63.8823
↓ -0.08 ₹1,886 3.6 5.3 10.3 9.2 9.1 6.49% 6Y 11M 1D 9Y 8M 26D Note: Returns up to 1 year are on absolute basis & more than 1 year are on CAGR basis. as on 13 Jun 25
"The primary investment objective of the Scheme is to seek capital appreciation by investing predominantly in units of MLIIF - WGF. The Scheme may, at the discretion of the Investment Manager, also invest in the units of other similar overseas mutual fund schemes, which may constitute a significant part of its corpus. The Scheme may also invest a certain portion of its corpus in money market securities and/or units of money market/liquid schemes of DSP Merrill Lynch Mutual Fund, in order to meet liquidity requirements from time to time. However, there is no assurance that the investment objective of the Scheme will be realized." DSP BlackRock World Gold Fund is a Equity - Global fund was launched on 14 Sep 07. It is a fund with High risk and has given a Below is the key information for DSP BlackRock World Gold Fund Returns up to 1 year are on The primary objective of the Scheme is to achieve long-term capital appreciation by investing in equity & equity related instruments of mid cap & small cap companies. Principal Emerging Bluechip Fund is a Equity - Large & Mid Cap fund was launched on 12 Nov 08. It is a fund with Moderately High risk and has given a Below is the key information for Principal Emerging Bluechip Fund Returns up to 1 year are on An Open ended Fund of Funds Scheme with the investment objective to provide returns that tracks returns provided by Birla Sun Life Gold ETF (BSL Gold ETF). Aditya Birla Sun Life Gold Fund is a Gold - Gold fund was launched on 20 Mar 12. It is a fund with Moderately High risk and has given a Below is the key information for Aditya Birla Sun Life Gold Fund Returns up to 1 year are on The scheme seeks to provide returns that closely correspond to returns provided by SBI - ETF Gold (Previously known as SBI GETS). SBI Gold Fund is a Gold - Gold fund was launched on 12 Sep 11. It is a fund with Moderately High risk and has given a Below is the key information for SBI Gold Fund Returns up to 1 year are on ICICI Prudential Regular Gold Savings Fund (the Scheme) is a fund of funds scheme with the primary objective to generate returns by investing in units of ICICI Prudential Gold Exchange Traded Fund (IPru Gold ETF).
However, there can be no assurance that the investment objectives of the Scheme will be realized. ICICI Prudential Regular Gold Savings Fund is a Gold - Gold fund was launched on 11 Oct 11. It is a fund with Moderately High risk and has given a Below is the key information for ICICI Prudential Regular Gold Savings Fund Returns up to 1 year are on The investment objective of the Scheme is to seek to provide returns that closely correspond to returns provided by Reliance ETF Gold BeES. Nippon India Gold Savings Fund is a Gold - Gold fund was launched on 7 Mar 11. It is a fund with Moderately High risk and has given a Below is the key information for Nippon India Gold Savings Fund Returns up to 1 year are on To seek capital appreciation by investing in units of HDFC Gold Exchange Traded Fund (HGETF). HDFC Gold Fund is a Gold - Gold fund was launched on 24 Oct 11. It is a fund with Moderately High risk and has given a Below is the key information for HDFC Gold Fund Returns up to 1 year are on The investment objective of the scheme is to generate returns by investing in units of Kotak Gold Exchange Traded Fund. Kotak Gold Fund is a Gold - Gold fund was launched on 25 Mar 11. It is a fund with Moderately High risk and has given a Below is the key information for Kotak Gold Fund Returns up to 1 year are on To generate returns that closely correspond to returns generated by Axis Gold ETF. Axis Gold Fund is a Gold - Gold fund was launched on 20 Oct 11. It is a fund with Moderately High risk and has given a Below is the key information for Axis Gold Fund Returns up to 1 year are on To generate long term capital appreciation from a portfolio that is predominantly in equity and equity related instruments HDFC Long Term Advantage Fund is a Equity - ELSS fund was launched on 2 Jan 01. It is a fund with Moderately High risk and has given a Below is the key information for HDFC Long Term Advantage Fund Returns up to 1 year are on 1. DSP BlackRock World Gold Fund
CAGR/Annualized return of 6.6% since its launch. Ranked 11 in Global category. Return for 2024 was 15.9% , 2023 was 7% and 2022 was -7.7% . DSP BlackRock World Gold Fund
Growth Launch Date 14 Sep 07 NAV (12 Jun 25) ₹31.177 ↑ 0.90 (2.96 %) Net Assets (Cr) ₹1,163 on 30 Apr 25 Category Equity - Global AMC DSP BlackRock Invmt Managers Pvt. Ltd. Rating ☆☆☆ Risk High Expense Ratio 1.35 Sharpe Ratio 1.52 Information Ratio -0.21 Alpha Ratio 1.14 Min Investment 1,000 Min SIP Investment 500 Exit Load 0-12 Months (1%),12 Months and above(NIL) Growth of 10,000 investment over the years.
Date Value 31 May 20 ₹10,000 31 May 21 ₹10,912 31 May 22 ₹9,016 31 May 23 ₹9,312 31 May 24 ₹10,653 31 May 25 ₹15,913 Returns for DSP BlackRock World Gold Fund
absolute basis & more than 1 year are on CAGR (Compound Annual Growth Rate) basis. as on 12 Jun 25 Duration Returns 1 Month 8.7% 3 Month 27.2% 6 Month 42.5% 1 Year 65.1% 3 Year 25.1% 5 Year 11.4% 10 Year 15 Year Since launch 6.6% Historical performance (Yearly) on absolute basis
Year Returns 2024 15.9% 2023 7% 2022 -7.7% 2021 -9% 2020 31.4% 2019 35.1% 2018 -10.7% 2017 -4% 2016 52.7% 2015 -18.5% Fund Manager information for DSP BlackRock World Gold Fund
Name Since Tenure Jay Kothari 1 Mar 13 12.26 Yr. Data below for DSP BlackRock World Gold Fund as on 30 Apr 25
Equity Sector Allocation
Sector Value Basic Materials 90.73% Asset Allocation
Asset Class Value Cash 5.24% Equity 91.1% Debt 0.04% Other 3.62% Top Securities Holdings / Portfolio
Name Holding Value Quantity BGF World Gold I2
Investment Fund | -78% ₹913 Cr 1,684,538
↓ -117,413 VanEck Gold Miners ETF
- | GDX21% ₹239 Cr 573,719 Treps / Reverse Repo Investments
CBLO/Reverse Repo | -2% ₹18 Cr Net Receivables/Payables
Net Current Assets | -1% -₹7 Cr 2. Principal Emerging Bluechip Fund
CAGR/Annualized return of 24.8% since its launch. Ranked 1 in Large & Mid Cap category. . Principal Emerging Bluechip Fund
Growth Launch Date 12 Nov 08 NAV (31 Dec 21) ₹183.316 ↑ 2.03 (1.12 %) Net Assets (Cr) ₹3,124 on 30 Nov 21 Category Equity - Large & Mid Cap AMC Principal Pnb Asset Mgmt. Co. Priv. Ltd. Rating ☆☆☆☆☆ Risk Moderately High Expense Ratio 2.08 Sharpe Ratio 2.74 Information Ratio 0.22 Alpha Ratio 2.18 Min Investment 5,000 Min SIP Investment 100 Exit Load 0-1 Years (1%),1 Years and above(NIL) Growth of 10,000 investment over the years.
Date Value 31 May 20 ₹10,000 31 May 21 ₹17,195 Returns for Principal Emerging Bluechip Fund
absolute basis & more than 1 year are on CAGR (Compound Annual Growth Rate) basis. as on 12 Jun 25 Duration Returns 1 Month 2.9% 3 Month 2.9% 6 Month 13.6% 1 Year 38.9% 3 Year 21.9% 5 Year 19.2% 10 Year 15 Year Since launch 24.8% Historical performance (Yearly) on absolute basis
Year Returns 2024 2023 2022 2021 2020 2019 2018 2017 2016 2015 Fund Manager information for Principal Emerging Bluechip Fund
Name Since Tenure Data below for Principal Emerging Bluechip Fund as on 30 Nov 21
Equity Sector Allocation
Sector Value Asset Allocation
Asset Class Value Top Securities Holdings / Portfolio
Name Holding Value Quantity 3. Aditya Birla Sun Life Gold Fund
CAGR/Annualized return of 8.4% since its launch. Return for 2024 was 18.7% , 2023 was 14.5% and 2022 was 12.3% . Aditya Birla Sun Life Gold Fund
Growth Launch Date 20 Mar 12 NAV (13 Jun 25) ₹29.2364 ↑ 0.72 (2.51 %) Net Assets (Cr) ₹601 on 30 Apr 25 Category Gold - Gold AMC Birla Sun Life Asset Management Co Ltd Rating ☆☆☆ Risk Moderately High Expense Ratio 0.51 Sharpe Ratio 1.6 Information Ratio 0 Alpha Ratio 0 Min Investment 100 Min SIP Investment 100 Exit Load 0-365 Days (1%),365 Days and above(NIL) Growth of 10,000 investment over the years.
Date Value 31 May 20 ₹10,000 31 May 21 ₹10,356 31 May 22 ₹10,637 31 May 23 ₹12,354 31 May 24 ₹14,696 31 May 25 ₹19,049 Returns for Aditya Birla Sun Life Gold Fund
absolute basis & more than 1 year are on CAGR (Compound Annual Growth Rate) basis. as on 12 Jun 25 Duration Returns 1 Month 5.6% 3 Month 14.7% 6 Month 29.1% 1 Year 37.5% 3 Year 23.2% 5 Year 14.6% 10 Year 15 Year Since launch 8.4% Historical performance (Yearly) on absolute basis
Year Returns 2024 18.7% 2023 14.5% 2022 12.3% 2021 -5% 2020 26% 2019 21.3% 2018 6.8% 2017 1.6% 2016 11.5% 2015 -7.2% Fund Manager information for Aditya Birla Sun Life Gold Fund
Name Since Tenure Priya Sridhar 31 Dec 24 0.41 Yr. Data below for Aditya Birla Sun Life Gold Fund as on 30 Apr 25
Asset Allocation
Asset Class Value Cash 1.78% Other 98.22% Top Securities Holdings / Portfolio
Name Holding Value Quantity Aditya BSL Gold ETF
- | -100% ₹600 Cr 71,501,034
↑ 1,440,764 Clearing Corporation Of India Limited
CBLO/Reverse Repo | -1% ₹3 Cr Net Receivables / (Payables)
Net Current Assets | -0% -₹3 Cr 4. SBI Gold Fund
CAGR/Annualized return of 8.1% since its launch. Return for 2024 was 19.6% , 2023 was 14.1% and 2022 was 12.6% . SBI Gold Fund
Growth Launch Date 12 Sep 11 NAV (13 Jun 25) ₹29.2944 ↑ 0.59 (2.05 %) Net Assets (Cr) ₹3,931 on 30 Apr 25 Category Gold - Gold AMC SBI Funds Management Private Limited Rating ☆☆ Risk Moderately High Expense Ratio 0.29 Sharpe Ratio 1.56 Information Ratio 0 Alpha Ratio 0 Min Investment 5,000 Min SIP Investment 500 Exit Load 0-1 Years (1%),1 Years and above(NIL) Growth of 10,000 investment over the years.
Date Value 31 May 20 ₹10,000 31 May 21 ₹10,390 31 May 22 ₹10,703 31 May 23 ₹12,495 31 May 24 ₹14,895 31 May 25 ₹19,303 Returns for SBI Gold Fund
absolute basis & more than 1 year are on CAGR (Compound Annual Growth Rate) basis. as on 12 Jun 25 Duration Returns 1 Month 4.9% 3 Month 14.1% 6 Month 28.4% 1 Year 37.1% 3 Year 23.1% 5 Year 14.6% 10 Year 15 Year Since launch 8.1% Historical performance (Yearly) on absolute basis
Year Returns 2024 19.6% 2023 14.1% 2022 12.6% 2021 -5.7% 2020 27.4% 2019 22.8% 2018 6.4% 2017 3.5% 2016 10% 2015 -8.1% Fund Manager information for SBI Gold Fund
Name Since Tenure Raj gandhi 1 Jan 13 12.42 Yr. Data below for SBI Gold Fund as on 30 Apr 25
Asset Allocation
Asset Class Value Cash 1.27% Other 98.73% Top Securities Holdings / Portfolio
Name Holding Value Quantity SBI Gold ETF
- | -100% ₹3,939 Cr 483,231,791
↑ 15,977,871 Net Receivable / Payable
CBLO | -1% -₹23 Cr Treps
CBLO/Reverse Repo | -0% ₹15 Cr 5. ICICI Prudential Regular Gold Savings Fund
CAGR/Annualized return of 8.7% since its launch. Return for 2024 was 19.5% , 2023 was 13.5% and 2022 was 12.7% . ICICI Prudential Regular Gold Savings Fund
Growth Launch Date 11 Oct 11 NAV (13 Jun 25) ₹31.1193 ↑ 0.71 (2.34 %) Net Assets (Cr) ₹2,057 on 30 Apr 25 Category Gold - Gold AMC ICICI Prudential Asset Management Company Limited Rating ☆ Risk Moderately High Expense Ratio 0.4 Sharpe Ratio 1.54 Information Ratio 0 Alpha Ratio 0 Min Investment 5,000 Min SIP Investment 100 Exit Load 0-15 Months (2%),15 Months and above(NIL) Growth of 10,000 investment over the years.
Date Value 31 May 20 ₹10,000 31 May 21 ₹10,309 31 May 22 ₹10,650 31 May 23 ₹12,349 31 May 24 ₹14,729 31 May 25 ₹19,112 Returns for ICICI Prudential Regular Gold Savings Fund
absolute basis & more than 1 year are on CAGR (Compound Annual Growth Rate) basis. as on 12 Jun 25 Duration Returns 1 Month 5.4% 3 Month 14.4% 6 Month 28.9% 1 Year 37% 3 Year 23.2% 5 Year 14.5% 10 Year 15 Year Since launch 8.7% Historical performance (Yearly) on absolute basis
Year Returns 2024 19.5% 2023 13.5% 2022 12.7% 2021 -5.4% 2020 26.6% 2019 22.7% 2018 7.4% 2017 0.8% 2016 8.9% 2015 -5.1% Fund Manager information for ICICI Prudential Regular Gold Savings Fund
Name Since Tenure Manish Banthia 27 Sep 12 12.68 Yr. Nishit Patel 29 Dec 20 4.42 Yr. Data below for ICICI Prudential Regular Gold Savings Fund as on 30 Apr 25
Asset Allocation
Asset Class Value Cash 1.59% Other 98.41% Top Securities Holdings / Portfolio
Name Holding Value Quantity ICICI Pru Gold ETF
- | -100% ₹2,053 Cr 251,671,554
↑ 3,890,309 Treps
CBLO/Reverse Repo | -1% ₹11 Cr Net Current Assets
Net Current Assets | -0% -₹8 Cr 6. Nippon India Gold Savings Fund
CAGR/Annualized return of 9.9% since its launch. Return for 2024 was 19% , 2023 was 14.3% and 2022 was 12.3% . Nippon India Gold Savings Fund
Growth Launch Date 7 Mar 11 NAV (13 Jun 25) ₹38.3964 ↑ 0.80 (2.14 %) Net Assets (Cr) ₹2,959 on 30 Apr 25 Category Gold - Gold AMC Nippon Life Asset Management Ltd. Rating ☆☆ Risk Moderately High Expense Ratio 0.34 Sharpe Ratio 1.53 Information Ratio 0 Alpha Ratio 0 Min Investment 5,000 Min SIP Investment 100 Exit Load 0-1 Years (2%),1 Years and above(NIL) Growth of 10,000 investment over the years.
Date Value 31 May 20 ₹10,000 31 May 21 ₹10,352 31 May 22 ₹10,637 31 May 23 ₹12,332 31 May 24 ₹14,732 31 May 25 ₹19,039 Returns for Nippon India Gold Savings Fund
absolute basis & more than 1 year are on CAGR (Compound Annual Growth Rate) basis. as on 12 Jun 25 Duration Returns 1 Month 5.1% 3 Month 14.1% 6 Month 28.4% 1 Year 36.7% 3 Year 23% 5 Year 14.3% 10 Year 15 Year Since launch 9.9% Historical performance (Yearly) on absolute basis
Year Returns 2024 19% 2023 14.3% 2022 12.3% 2021 -5.5% 2020 26.6% 2019 22.5% 2018 6% 2017 1.7% 2016 11.6% 2015 -8.1% Fund Manager information for Nippon India Gold Savings Fund
Name Since Tenure Himanshu Mange 23 Dec 23 1.44 Yr. Data below for Nippon India Gold Savings Fund as on 30 Apr 25
Asset Allocation
Asset Class Value Cash 1.45% Other 98.55% Top Securities Holdings / Portfolio
Name Holding Value Quantity Nippon India ETF Gold BeES
- | -100% ₹2,960 Cr 374,289,097
↑ 4,429,805 Net Current Assets
Net Current Assets | -0% -₹12 Cr Triparty Repo
CBLO/Reverse Repo | -0% ₹11 Cr Cash Margin - Ccil
CBLO | -0% ₹0 Cr Cash
Net Current Assets | -0% ₹0 Cr 00 7. HDFC Gold Fund
CAGR/Annualized return of 8.4% since its launch. Return for 2024 was 18.9% , 2023 was 14.1% and 2022 was 12.7% . HDFC Gold Fund
Growth Launch Date 24 Oct 11 NAV (13 Jun 25) ₹29.9796 ↑ 0.59 (2.02 %) Net Assets (Cr) ₹3,871 on 30 Apr 25 Category Gold - Gold AMC HDFC Asset Management Company Limited Rating ☆ Risk Moderately High Expense Ratio 0.49 Sharpe Ratio 1.57 Information Ratio 0 Alpha Ratio 0 Min Investment 5,000 Min SIP Investment 300 Exit Load 0-6 Months (2%),6-12 Months (1%),12 Months and above(NIL) Growth of 10,000 investment over the years.
Date Value 31 May 20 ₹10,000 31 May 21 ₹10,378 31 May 22 ₹10,690 31 May 23 ₹12,397 31 May 24 ₹14,816 31 May 25 ₹19,178 Returns for HDFC Gold Fund
absolute basis & more than 1 year are on CAGR (Compound Annual Growth Rate) basis. as on 12 Jun 25 Duration Returns 1 Month 5.1% 3 Month 14.4% 6 Month 28.4% 1 Year 36.7% 3 Year 23% 5 Year 14.4% 10 Year 15 Year Since launch 8.4% Historical performance (Yearly) on absolute basis
Year Returns 2024 18.9% 2023 14.1% 2022 12.7% 2021 -5.5% 2020 27.5% 2019 21.7% 2018 6.6% 2017 2.8% 2016 10.1% 2015 -7.3% Fund Manager information for HDFC Gold Fund
Name Since Tenure Arun Agarwal 15 Feb 23 2.29 Yr. Nandita Menezes 29 Mar 25 0.17 Yr. Data below for HDFC Gold Fund as on 30 Apr 25
Asset Allocation
Asset Class Value Cash 1.44% Other 98.56% Top Securities Holdings / Portfolio
Name Holding Value Quantity HDFC Gold ETF
- | -100% ₹3,880 Cr 474,995,164
↑ 12,641,486 Net Current Assets
Net Current Assets | -1% -₹23 Cr Treps - Tri-Party Repo
CBLO/Reverse Repo | -0% ₹14 Cr 8. Kotak Gold Fund
CAGR/Annualized return of 10% since its launch. Return for 2024 was 18.9% , 2023 was 13.9% and 2022 was 11.7% . Kotak Gold Fund
Growth Launch Date 25 Mar 11 NAV (13 Jun 25) ₹38.5568 ↑ 0.83 (2.20 %) Net Assets (Cr) ₹3,028 on 30 Apr 25 Category Gold - Gold AMC Kotak Mahindra Asset Management Co Ltd Rating ☆ Risk Moderately High Expense Ratio 0.5 Sharpe Ratio 1.52 Information Ratio 0 Alpha Ratio 0 Min Investment 5,000 Min SIP Investment 1,000 Exit Load 0-6 Months (2%),6-12 Months (1%),12 Months and above(NIL) Growth of 10,000 investment over the years.
Date Value 31 May 20 ₹10,000 31 May 21 ₹10,358 31 May 22 ₹10,689 31 May 23 ₹12,301 31 May 24 ₹14,650 31 May 25 ₹18,973 Returns for Kotak Gold Fund
absolute basis & more than 1 year are on CAGR (Compound Annual Growth Rate) basis. as on 12 Jun 25 Duration Returns 1 Month 5.5% 3 Month 14% 6 Month 28.2% 1 Year 36.5% 3 Year 22.7% 5 Year 14.3% 10 Year 15 Year Since launch 10% Historical performance (Yearly) on absolute basis
Year Returns 2024 18.9% 2023 13.9% 2022 11.7% 2021 -4.7% 2020 26.6% 2019 24.1% 2018 7.3% 2017 2.5% 2016 10.2% 2015 -8.4% Fund Manager information for Kotak Gold Fund
Name Since Tenure Abhishek Bisen 25 Mar 11 14.2 Yr. Jeetu Sonar 1 Oct 22 2.67 Yr. Data below for Kotak Gold Fund as on 30 Apr 25
Asset Allocation
Asset Class Value Cash 2.2% Other 97.8% Top Securities Holdings / Portfolio
Name Holding Value Quantity Kotak Gold ETF
- | -100% ₹3,016 Cr 379,458,705
↑ 3,011,727 Triparty Repo
CBLO/Reverse Repo | -1% ₹18 Cr Net Current Assets/(Liabilities)
Net Current Assets | -0% -₹6 Cr 9. Axis Gold Fund
CAGR/Annualized return of 8.2% since its launch. Return for 2024 was 19.2% , 2023 was 14.7% and 2022 was 12.5% . Axis Gold Fund
Growth Launch Date 20 Oct 11 NAV (13 Jun 25) ₹29.2321 ↑ 0.58 (2.03 %) Net Assets (Cr) ₹1,033 on 30 Apr 25 Category Gold - Gold AMC Axis Asset Management Company Limited Rating ☆ Risk Moderately High Expense Ratio 0.24 Sharpe Ratio 1.54 Information Ratio 0 Alpha Ratio 0 Min Investment 5,000 Min SIP Investment 1,000 Exit Load 0-1 Years (1%),1 Years and above(NIL) Growth of 10,000 investment over the years.
Date Value 31 May 20 ₹10,000 31 May 21 ₹10,395 31 May 22 ₹10,765 31 May 23 ₹12,577 31 May 24 ₹14,943 31 May 25 ₹19,276 Returns for Axis Gold Fund
absolute basis & more than 1 year are on CAGR (Compound Annual Growth Rate) basis. as on 12 Jun 25 Duration Returns 1 Month 5.1% 3 Month 14.2% 6 Month 28.2% 1 Year 36.1% 3 Year 23% 5 Year 14.7% 10 Year 15 Year Since launch 8.2% Historical performance (Yearly) on absolute basis
Year Returns 2024 19.2% 2023 14.7% 2022 12.5% 2021 -4.7% 2020 26.9% 2019 23.1% 2018 8.3% 2017 0.7% 2016 10.7% 2015 -11.9% Fund Manager information for Axis Gold Fund
Name Since Tenure Aditya Pagaria 9 Nov 21 3.56 Yr. Pratik Tibrewal 1 Feb 25 0.33 Yr. Data below for Axis Gold Fund as on 30 Apr 25
Asset Allocation
Asset Class Value Cash 3.75% Other 96.25% Top Securities Holdings / Portfolio
Name Holding Value Quantity Axis Gold ETF
- | -98% ₹1,009 Cr 126,831,408
↑ 3,500,000 Clearing Corporation Of India Ltd
CBLO/Reverse Repo | -3% ₹28 Cr Net Receivables / (Payables)
CBLO | -0% -₹4 Cr 10. HDFC Long Term Advantage Fund
CAGR/Annualized return of 21.4% since its launch. Ranked 23 in ELSS category. . HDFC Long Term Advantage Fund
Growth Launch Date 2 Jan 01 NAV (14 Jan 22) ₹595.168 ↑ 0.28 (0.05 %) Net Assets (Cr) ₹1,318 on 30 Nov 21 Category Equity - ELSS AMC HDFC Asset Management Company Limited Rating ☆☆☆ Risk Moderately High Expense Ratio 2.25 Sharpe Ratio 2.27 Information Ratio -0.15 Alpha Ratio 1.75 Min Investment 500 Min SIP Investment 500 Exit Load NIL Growth of 10,000 investment over the years.
Date Value 31 May 20 ₹10,000 31 May 21 ₹17,522
Purchase not allowed Returns for HDFC Long Term Advantage Fund
absolute basis & more than 1 year are on CAGR (Compound Annual Growth Rate) basis. as on 12 Jun 25 Duration Returns 1 Month 4.4% 3 Month 1.2% 6 Month 15.4% 1 Year 35.5% 3 Year 20.6% 5 Year 17.4% 10 Year 15 Year Since launch 21.4% Historical performance (Yearly) on absolute basis
Year Returns 2024 2023 2022 2021 2020 2019 2018 2017 2016 2015 Fund Manager information for HDFC Long Term Advantage Fund
Name Since Tenure Data below for HDFC Long Term Advantage Fund as on 30 Nov 21
Equity Sector Allocation
Sector Value Asset Allocation
Asset Class Value Top Securities Holdings / Portfolio
Name Holding Value Quantity
Mutual Fund Companies in India
There are 42 Mutual Fund companies in India (called Asset Management Companies “AMCs”) which provide mutual fund schemes which investors can invest in. These Mutual Fund companies are regulated by SEBI. Some of the noticeable Mutual Fund Companies are:
1. SBI Mutual Fund
SBI Mutual Fund was set up in 1987 by the State Bank of India. Today SBI MF manages INR 1,57,025 crore (Mar-31-2017) of assets. It is one of largest asset management companies in India and offers over 70 funds across categories of equity, debt and balanced.
2. HDFC Mutual Fund
Setup in the year 2000, HDFC asset management company is one of the prominent asset managers looking after some famous names such as HDFC Equity Funds and the HDFC top 200 Fund. Today, it manages INR 2,37,177 crore (Mar-31-2017) of assets. It has schemes across asset classes and boasts of over 63 schemes that it manages. It is backed by the parent of the very large banking institution called Housing Development Finance Corporation (HDFC).
3. Nippon India Mutual Fund
Setup in 1995, Nippon India Mutual Fund (formerly known as Reliance Mutual Fund) is one of the oldest AMCs in India. With explosive growth over the last 2 decades, today it has over 210890 crores (Mar-31-2017) of assets under management. It manages some of the oldest funds in the industry such as Nippon India Vision Fund, Nippon India Banking Fund, Nippon India Liquid Fund, etc.
4. UTI Mutual Fund
UTI Mutual Fund is the oldest asset management company in India. Mutual Funds in India started in 1963 with the formation of the Unit Trust of India (UTI), since then UTI has grown over the years. Today, UTI AMC is a very large asset manager with assets of 1,36,810 crore (Mar-31-2017). Some of its prominent funds are UTI equity fund and UTI MNC Fund. It offers fund across asset classes.
5. Franklin Templeton Mutual Fund
Franklin Mutual Fund was set up in 1995. It is also a large fund house with assets of 81,615 crores (Mar-31-2017). Franklin Templeton Mutual Fund is backed by the US parent Templeton International Inc. Franklin Templeton Mutual Fund is a very process driven fund house
6. LIC Mutual Fund
Backed by the Life Insurance Corporation of India (LIC), this mutual fund company started operations in 1994. Today it manages about INR 21,475 crore (Mar-31-2017) of assets.
7. Blackrock Mutual Fund
DSP BlackRock Mutual Fund is a joint venture of DSP Group and BlackRock Inc. Setup in 1996 the fund house manages across asset classes. It manages names such as the DSP Blackrock Microcap Fund & the DSP Blackrock taxsaver Fund.
How to Invest in Mutual Funds?
How to invest in Mutual Funds?There are various avenues to invest, one can go directly to funds houses, also one can use the services of a broker or distributor or one can even use a financial advisor. There are many advantages of using the services of a distributor, instead of going to different AMCs, making the process cumbersome one can use a distributor who can help interact and do the purchases & redemptions with all of them and make the process easy for the investor. Today, investors can also make the purchase of mutual funds online and be sitting at home to complete the entire process.
Mutual Fund Investment Plans
One can make various Mutual Fund investment plans given the risk profile of the investor. For those who can take higher risk, there are equity funds and for those with lower risk, there are debt/money market funds. One can do goal planning with various calculators to achieve a goal such as buying a house, car or any other asset. Using a SIP over a period of time one can try and achieve these goals. Also, using asset allocation one can choose the mix of assets given the level of risk one can tolerate.
Mutual Fund NAV
The industry is very transparent; funds are required to publish their prices daily. The price is known as the Net Asset Value (NAV). All mutual funds are required by SEBI to publish their NAV daily. The NAVs are published on websites of most AMCs as well as at the website of AMFI to ensure transparency.
Mutual Fund Calculator
The mutual fund calculator is a very important tool to plan for goals using SIPs and also to see how one can grow using the systematic investment plan. Taking basic inputs such as expected growth rate and inflation it can do all sorts of calculations. Access the calculator here:
Know Your Monthly SIP Amount
Index Funds
Today, there are many index funds also available on the mutual fund platform. These are offered by various mutual fund companies. Other than index funds, there are various Exchange Traded Fund (ETFs) also available on the mutual fund platform.Nifty ETFs, Gold ETFs etc to name a few are all available in the fund's form.
Mutual Fund Ratings
Mutual funds ratings today are provided by many players like CRISIL, ICRA, MorningStar etc to name a few. mutual fund ratings usually take in a number of quantitative as well as qualitative factors to arrive at the final rating. The Mutual Fund rating is a good starting point for an investor in selecting the scheme.
Today, mutual funds have become an important route for retail investors, and choosing the best fund is very important for investors. Investors should always do their bit of research in understanding which funds to invest in and choosing the right distributor/advisor to help them on this journey.
All efforts have been made to ensure the information provided here is accurate. However, no guarantees are made regarding correctness of data. Please verify with scheme information document before making any investment.
")
 Mutual Fund in India")


AMFI Registration No. 112358 | CIN: U74999MH2016PTC282153
Shepard Technologies Pvt. Ltd. (with ARN code 112358) makes no warranties or representations, express or implied, on products offered through the platform. It accepts no liability for any damages or losses, however caused, in connection with the use of, or on the reliance of its product or related services. Terms and conditions of the website are applicable.
©2025 Shepard Technologies Private Limited. All Rights Reserved
Thanks A Lot for more valuable information. Please provide such information on insurance life and health
Best mutual fund for 2 to 5 year investment in single schemes
Educative and very Useful information. Thank you.
Great Read. Informative Page about all types of mutual funds.