મ્યુચ્યુઅલ ફંડમાં એકસાથે રોકાણ
શું તમે જાણો છો કે તમે એકસાથે રકમનું રોકાણ કરી શકો છોમ્યુચ્યુઅલ ફંડ? જો હા, તો તે સારું છે. જો કે, જો ના, તો ચિંતા કરશો નહીં. આ લેખ તમને તે વિશે માર્ગદર્શન આપશે. મ્યુચ્યુઅલ ફંડમાં એકસાથે રોકાણ એ એવી પરિસ્થિતિનો સંદર્ભ આપે છે જ્યારે વ્યક્તિ એક સમયે મ્યુચ્યુઅલ ફંડમાં નાણાંનું રોકાણ કરે છે. અહીં, ડિપોઝિટ એકથી વધુ વખત થતી નથી. વચ્ચે ઘણો તફાવત છેSIP અને મૂડીરોકાણનો એકસામટો મોડ. તો, ચાલો મ્યુચ્યુઅલ ફંડમાં એકસાથે રોકાણની વિભાવનાને સમજીએ,શ્રેષ્ઠ મ્યુચ્યુઅલ ફંડ એકસાથે રોકાણ માટે, આ લેખ દ્વારા એકમ રકમના રોકાણ દરમિયાન ધ્યાનમાં લેવાની બાબતો, મ્યુચ્યુઅલ ફંડ લમ્પ સમ રિટર્ન કેલ્ક્યુલેટર અને અન્ય સંબંધિત પાસાઓ.

મ્યુચ્યુઅલ ફંડમાં લમ્પ સમ ઇન્વેસ્ટમેન્ટનો અર્થ શું છે?
મ્યુચ્યુઅલ ફંડમાં એકસાથે રોકાણ એ એક દૃશ્ય છે જ્યાં વ્યક્તિઓમ્યુચ્યુઅલ ફંડમાં રોકાણ કરો માત્ર એક જ વાર માટે. જો કે, રોકાણના SIP મોડથી વિપરીત જ્યાં વ્યક્તિઓ એકસાથે નાની રકમ જમા કરે છે, વ્યક્તિઓ નોંધપાત્ર રકમ જમા કરે છે. બીજા શબ્દોમાં કહીએ તો, તે એક-શોટ તકનીક છેરોકાણ મ્યુચ્યુઅલ ફંડમાં. રોકાણકારો માટે યોગ્ય રોકાણનો એકસામટો મોડ જેમની પાસે વધારાનું ભંડોળ છે જે તેમનામાં આદર્શ છેબેંક એકાઉન્ટ અને વધુ કમાણી કરવા માટે ચેનલો શોધી રહ્યા છેઆવક મ્યુચ્યુઅલ ફંડમાં રોકાણ કરીને.
2022 - 2023 માં એકસાથે રોકાણ માટે શ્રેષ્ઠ મ્યુચ્યુઅલ ફંડ
તમે લમ્પ સમ મોડ દ્વારા મ્યુચ્યુઅલ ફંડમાં રોકાણ કરો તે પહેલાં, વ્યક્તિઓએ વિવિધ પરિમાણો જેમ કે AUM, રોકાણની રકમ અને ઘણું બધું ધ્યાનમાં લેવાની જરૂર છે. તેથી, આ પરિમાણોના આધારે એકસાથે રોકાણ માટેના કેટલાક શ્રેષ્ઠ મ્યુચ્યુઅલ ફંડ નીચે મુજબ છે.
ઇક્વિટી મ્યુચ્યુઅલ ફંડ્સમાં શ્રેષ્ઠ લમ્પ રોકાણ
ઇક્વિટી ફંડ્સ વિવિધ કંપનીઓના ઇક્વિટી અને ઇક્વિટી-સંબંધિત સાધનોમાં તેમના ભંડોળનું રોકાણ કરતી યોજનાઓ છે. આ યોજનાઓ લાંબા ગાળાના રોકાણ માટે સારો વિકલ્પ માનવામાં આવે છે. જો કે વ્યક્તિઓ ઇક્વિટી ફંડ્સમાં એકસાથે રકમનું રોકાણ કરી શકે છે, તેમ છતાં ઇક્વિટી ફંડ્સમાં રોકાણ કરવાની ભલામણ કરેલ તકનીક કાં તો SIP દ્વારા અથવાવ્યવસ્થિત ટ્રાન્સફર પ્લાન (STP) મોડ. STP મોડમાં, વ્યક્તિઓ પહેલા નોંધપાત્ર નાણાં જમા કરે છેડેટ ફંડ જેમ કેલિક્વિડ ફંડ્સ અને પછી ઇક્વિટી ફંડમાં નિયમિત સમયાંતરે નાણાં ટ્રાન્સફર કરવામાં આવે છે. કેટલાક ઇક્વિટી મ્યુચ્યુઅલ ફંડ કે જે રોકાણ માટે ધ્યાનમાં લઈ શકાય છે તે નીચે મુજબ છે.
Fund NAV Net Assets (Cr) Min Investment 3 MO (%) 6 MO (%) 1 YR (%) 3 YR (%) 5 YR (%) 2024 (%) ICICI Prudential Infrastructure Fund Growth ₹202.51
↑ 0.83 ₹8,550 5,000 1.1 5.4 4.6 18.4 23 6.7 SBI PSU Fund Growth ₹34.3228
↑ 0.27 ₹6,684 5,000 -4.4 -1.7 9.6 22.4 22.9 11.3 LIC MF Infrastructure Fund Growth ₹54.5662
↑ 0.75 ₹1,137 5,000 5.3 14.5 9.8 24.5 22.4 -3.7 DSP World Gold Fund Growth ₹50.4247
↑ 1.63 ₹1,433 1,000 -12.7 -17.8 62.8 43.6 22.1 167.1 Nippon India Power and Infra Fund Growth ₹381.086
↑ 3.66 ₹8,043 5,000 0.6 14 11.4 19.9 22 -0.5 Note: Returns up to 1 year are on absolute basis & more than 1 year are on CAGR basis. as on 31 Jul 26 Research Highlights & Commentary of 5 Funds showcased
Commentary ICICI Prudential Infrastructure Fund SBI PSU Fund LIC MF Infrastructure Fund DSP World Gold Fund Nippon India Power and Infra Fund Point 1 Highest AUM (₹8,550 Cr). Lower mid AUM (₹6,684 Cr). Bottom quartile AUM (₹1,137 Cr). Bottom quartile AUM (₹1,433 Cr). Upper mid AUM (₹8,043 Cr). Point 2 Established history (20+ yrs). Established history (16+ yrs). Established history (18+ yrs). Established history (18+ yrs). Oldest track record among peers (22 yrs). Point 3 Rating: 3★ (upper mid). Rating: 2★ (bottom quartile). Not Rated. Rating: 3★ (lower mid). Top rated. Point 4 Risk profile: High. Risk profile: High. Risk profile: High. Risk profile: High. Risk profile: High. Point 5 5Y return: 22.96% (top quartile). 5Y return: 22.88% (upper mid). 5Y return: 22.40% (lower mid). 5Y return: 22.15% (bottom quartile). 5Y return: 21.98% (bottom quartile). Point 6 3Y return: 18.40% (bottom quartile). 3Y return: 22.37% (lower mid). 3Y return: 24.50% (upper mid). 3Y return: 43.62% (top quartile). 3Y return: 19.91% (bottom quartile). Point 7 1Y return: 4.59% (bottom quartile). 1Y return: 9.60% (bottom quartile). 1Y return: 9.79% (lower mid). 1Y return: 62.77% (top quartile). 1Y return: 11.37% (upper mid). Point 8 Alpha: 0.00 (bottom quartile). Alpha: -0.30 (bottom quartile). Alpha: 8.41 (upper mid). Alpha: 2.12 (lower mid). Alpha: 8.81 (top quartile). Point 9 Sharpe: -0.07 (bottom quartile). Sharpe: 0.12 (bottom quartile). Sharpe: 0.22 (lower mid). Sharpe: 1.22 (top quartile). Sharpe: 0.24 (upper mid). Point 10 Information ratio: 0.00 (lower mid). Information ratio: -0.11 (bottom quartile). Information ratio: 0.58 (top quartile). Information ratio: -0.50 (bottom quartile). Information ratio: 0.56 (upper mid). ICICI Prudential Infrastructure Fund
SBI PSU Fund
LIC MF Infrastructure Fund
DSP World Gold Fund
Nippon India Power and Infra Fund
Talk to our investment specialist
ડેટ મ્યુચ્યુઅલ ફંડમાં શ્રેષ્ઠ એકસાથે રોકાણ
ડેટ ફંડ્સ તેમના ફંડના નાણાંનું રોકાણ અલગ-અલગમાં કરે છેનિશ્ચિત આવક ટ્રેઝરી બિલ, કોર્પોરેટ જેવા સાધનોબોન્ડ, અને ઘણું બધું. આ યોજનાઓને ટૂંકા અને મધ્યમ ગાળા માટે સારો વિકલ્પ માનવામાં આવે છે. ઘણી વ્યક્તિઓ ડેટ મ્યુચ્યુઅલ ફંડમાં એકસાથે નાણાંનું રોકાણ કરવાનું પસંદ કરે છે. કેટલાકશ્રેષ્ઠ દેવું ભંડોળ જે એકસાથે રોકાણ માટે પસંદ કરી શકાય છે તે નીચે મુજબ છે.
Fund NAV Net Assets (Cr) Min Investment 3 MO (%) 6 MO (%) 1 YR (%) 3 YR (%) 2024 (%) Debt Yield (YTM) Mod. Duration Eff. Maturity DSP Credit Risk Fund Growth ₹54.9552
↑ 0.01 ₹275 1,000 2.9 8.1 10.1 16 21 7.73% 2Y 1M 28D 2Y 10M 17D Aditya Birla Sun Life Credit Risk Fund Growth ₹25.2587
↑ 0.01 ₹1,461 1,000 2.7 4.8 11.9 12.2 13.4 7.98% 2Y 29D 2Y 9M 4D Franklin India Credit Risk Fund Growth ₹25.3348
↑ 0.04 ₹104 5,000 2.9 5 7.5 11 0% Aditya Birla Sun Life Medium Term Plan Growth ₹43.6388
↑ 0.02 ₹3,213 1,000 2.7 4 8.4 9.9 10.9 8.05% 3Y 1M 20D 4Y 7M 24D Franklin India Ultra Short Bond Fund - Super Institutional Plan Growth ₹34.9131
↑ 0.04 ₹297 10,000 1.3 5.9 13.7 8.8 0% 1Y 15D Note: Returns up to 1 year are on absolute basis & more than 1 year are on CAGR basis. as on 31 Jul 26 Research Highlights & Commentary of 5 Funds showcased
Commentary DSP Credit Risk Fund Aditya Birla Sun Life Credit Risk Fund Franklin India Credit Risk Fund Aditya Birla Sun Life Medium Term Plan Franklin India Ultra Short Bond Fund - Super Institutional Plan Point 1 Bottom quartile AUM (₹275 Cr). Upper mid AUM (₹1,461 Cr). Bottom quartile AUM (₹104 Cr). Highest AUM (₹3,213 Cr). Lower mid AUM (₹297 Cr). Point 2 Oldest track record among peers (23 yrs). Established history (11+ yrs). Established history (14+ yrs). Established history (17+ yrs). Established history (18+ yrs). Point 3 Top rated. Not Rated. Rating: 1★ (lower mid). Rating: 4★ (upper mid). Rating: 1★ (bottom quartile). Point 4 Risk profile: Moderate. Risk profile: Moderate. Risk profile: Moderate. Risk profile: Moderate. Risk profile: Moderate. Point 5 1Y return: 10.15% (lower mid). 1Y return: 11.87% (upper mid). 1Y return: 7.45% (bottom quartile). 1Y return: 8.44% (bottom quartile). 1Y return: 13.69% (top quartile). Point 6 1M return: 0.34% (bottom quartile). 1M return: 0.47% (lower mid). 1M return: 0.91% (top quartile). 1M return: 0.30% (bottom quartile). 1M return: 0.59% (upper mid). Point 7 Sharpe: 0.76 (bottom quartile). Sharpe: 1.95 (upper mid). Sharpe: 0.29 (bottom quartile). Sharpe: 1.29 (lower mid). Sharpe: 2.57 (top quartile). Point 8 Information ratio: 0.00 (top quartile). Information ratio: 0.00 (upper mid). Information ratio: 0.00 (lower mid). Information ratio: 0.00 (bottom quartile). Information ratio: 0.00 (bottom quartile). Point 9 Yield to maturity (debt): 7.73% (lower mid). Yield to maturity (debt): 7.98% (upper mid). Yield to maturity (debt): 0.00% (bottom quartile). Yield to maturity (debt): 8.05% (top quartile). Yield to maturity (debt): 0.00% (bottom quartile). Point 10 Modified duration: 2.16 yrs (bottom quartile). Modified duration: 2.08 yrs (lower mid). Modified duration: 0.00 yrs (top quartile). Modified duration: 3.14 yrs (bottom quartile). Modified duration: 0.00 yrs (upper mid). DSP Credit Risk Fund
Aditya Birla Sun Life Credit Risk Fund
Franklin India Credit Risk Fund
Aditya Birla Sun Life Medium Term Plan
Franklin India Ultra Short Bond Fund - Super Institutional Plan
લમ્પ સમ ઇન્વેસ્ટમેન્ટ માટે શ્રેષ્ઠ હાઇબ્રિડ ફંડ
હાઇબ્રિડ ફંડ તરીકે પણ ઓળખાય છેસંતુલિત ભંડોળ ઇક્વિટી અને નિશ્ચિત આવકના સાધનો બંનેમાં તેમના નાણાંનું રોકાણ કરો. આ યોજનાઓ શોધી રહેલા વ્યક્તિઓ માટે યોગ્ય છેપાટનગર નિયમિત આવક સાથે પેઢી. સંતુલિત યોજનાઓ તરીકે પણ ઓળખાય છે, વ્યક્તિઓ હાઇબ્રિડ યોજનાઓમાં એકસાથે રકમનું રોકાણ કરવાનું પસંદ કરી શકે છે. એકસાથે રોકાણ માટેના કેટલાક શ્રેષ્ઠ હાઇબ્રિડ ફંડ્સ નીચે સૂચિબદ્ધ છે.
Fund NAV Net Assets (Cr) Min Investment 3 MO (%) 6 MO (%) 1 YR (%) 3 YR (%) 5 YR (%) 2024 (%) BOI AXA Mid and Small Cap Equity and Debt Fund Growth ₹41.84
↑ 0.20 ₹1,695 5,000 4.5 10.7 9.8 16.8 13.8 -0.9 Sundaram Equity Hybrid Fund Growth ₹135.137
↑ 0.78 ₹1,954 5,000 0.5 10.5 27.1 16 14.2 UTI Multi Asset Fund Growth ₹79.0729
↑ 0.14 ₹6,890 5,000 2.3 -0.6 7.1 15.2 13.4 11.1 SBI Multi Asset Allocation Fund Growth ₹66.5157
↓ -0.09 ₹19,354 5,000 0.8 -0.6 11.5 15.2 13.1 18.6 ICICI Prudential Multi-Asset Fund Growth ₹813.375
↑ 1.67 ₹84,991 5,000 1.7 -0.7 7.6 15 16.9 18.6 Note: Returns up to 1 year are on absolute basis & more than 1 year are on CAGR basis. as on 31 Jul 26 Research Highlights & Commentary of 5 Funds showcased
Commentary BOI AXA Mid and Small Cap Equity and Debt Fund Sundaram Equity Hybrid Fund UTI Multi Asset Fund SBI Multi Asset Allocation Fund ICICI Prudential Multi-Asset Fund Point 1 Bottom quartile AUM (₹1,695 Cr). Bottom quartile AUM (₹1,954 Cr). Lower mid AUM (₹6,890 Cr). Upper mid AUM (₹19,354 Cr). Highest AUM (₹84,991 Cr). Point 2 Established history (10+ yrs). Oldest track record among peers (26 yrs). Established history (17+ yrs). Established history (20+ yrs). Established history (23+ yrs). Point 3 Not Rated. Rating: 2★ (upper mid). Rating: 1★ (bottom quartile). Top rated. Rating: 2★ (lower mid). Point 4 Risk profile: Moderately High. Risk profile: Moderately High. Risk profile: Moderately High. Risk profile: Moderate. Risk profile: Moderately High. Point 5 5Y return: 13.77% (lower mid). 5Y return: 14.20% (upper mid). 5Y return: 13.37% (bottom quartile). 5Y return: 13.07% (bottom quartile). 5Y return: 16.90% (top quartile). Point 6 3Y return: 16.84% (top quartile). 3Y return: 16.03% (upper mid). 3Y return: 15.23% (lower mid). 3Y return: 15.18% (bottom quartile). 3Y return: 15.00% (bottom quartile). Point 7 1Y return: 9.85% (lower mid). 1Y return: 27.10% (top quartile). 1Y return: 7.13% (bottom quartile). 1Y return: 11.52% (upper mid). 1Y return: 7.61% (bottom quartile). Point 8 1M return: 0.34% (bottom quartile). 1M return: 1.80% (upper mid). 1M return: 2.16% (top quartile). 1M return: 0.26% (bottom quartile). 1M return: 1.66% (lower mid). Point 9 Alpha: 0.00 (upper mid). Alpha: 5.81 (top quartile). Alpha: 0.00 (lower mid). Alpha: 0.00 (bottom quartile). Alpha: 0.00 (bottom quartile). Point 10 Sharpe: 0.17 (lower mid). Sharpe: 2.64 (top quartile). Sharpe: -0.11 (bottom quartile). Sharpe: 0.53 (upper mid). Sharpe: 0.01 (bottom quartile). BOI AXA Mid and Small Cap Equity and Debt Fund
Sundaram Equity Hybrid Fund
UTI Multi Asset Fund
SBI Multi Asset Allocation Fund
ICICI Prudential Multi-Asset Fund
લમ્પ સમ ઇન્વેસ્ટમેન્ટ માટે શ્રેષ્ઠ ઇન્ડેક્સ ફંડ
ઇન્ડેક્સ ફંડના પોર્ટફોલિયોમાં શેર અને અન્ય સાધનોનો સમાવેશ થાય છે તે જ પ્રમાણમાં તે ઇન્ડેક્સમાં હોય છે. બીજા શબ્દોમાં કહીએ તો, આ યોજનાઓ ઇન્ડેક્સની કામગીરીની નકલ કરે છે. આ નિષ્ક્રિય રીતે સંચાલિત ફંડ્સ છે અને એકસાથે રોકાણ માટે એક સારા વિકલ્પ તરીકે ગણી શકાય. કેટલાક શ્રેષ્ઠઈન્ડેક્સ ફંડ્સ જે એકસાથે રોકાણ માટે પસંદ કરી શકાય છે તે નીચે મુજબ છે.
Fund NAV Net Assets (Cr) 3 MO (%) 6 MO (%) 1 YR (%) 3 YR (%) 5 YR (%) 2024 (%) Nippon India Index Fund - Sensex Plan Growth ₹39.949
↑ 0.08 ₹918 2.1 -4.6 -3.3 6.2 8.9 9.8 LIC MF Index Fund Sensex Growth ₹146.2
↑ 0.30 ₹90 1.9 -4.8 -3.8 5.6 8.4 9.1 Franklin India Index Fund Nifty Plan Growth ₹197.703
↑ 0.57 ₹723 2.1 -3.3 -1 7.9 9.7 11.3 IDBI Nifty Index Fund Growth ₹36.2111
↓ -0.02 ₹208 9.1 11.9 16.2 20.3 11.7 Nippon India Index Fund - Nifty Plan Growth ₹41.6356
↑ 0.12 ₹3,792 2.2 -3.2 -0.9 8 9.6 11.4 Note: Returns up to 1 year are on absolute basis & more than 1 year are on CAGR basis. as on 31 Jul 26 Research Highlights & Commentary of 5 Funds showcased
Commentary Nippon India Index Fund - Sensex Plan LIC MF Index Fund Sensex Franklin India Index Fund Nifty Plan IDBI Nifty Index Fund Nippon India Index Fund - Nifty Plan Point 1 Upper mid AUM (₹918 Cr). Bottom quartile AUM (₹90 Cr). Lower mid AUM (₹723 Cr). Bottom quartile AUM (₹208 Cr). Highest AUM (₹3,792 Cr). Point 2 Established history (15+ yrs). Established history (23+ yrs). Oldest track record among peers (26 yrs). Established history (16+ yrs). Established history (15+ yrs). Point 3 Top rated. Rating: 1★ (upper mid). Rating: 1★ (lower mid). Rating: 1★ (bottom quartile). Rating: 1★ (bottom quartile). Point 4 Risk profile: Moderately High. Risk profile: Moderately High. Risk profile: Moderately High. Risk profile: Moderately High. Risk profile: Moderately High. Point 5 5Y return: 8.88% (bottom quartile). 5Y return: 8.37% (bottom quartile). 5Y return: 9.65% (upper mid). 5Y return: 11.74% (top quartile). 5Y return: 9.64% (lower mid). Point 6 3Y return: 6.18% (bottom quartile). 3Y return: 5.59% (bottom quartile). 3Y return: 7.95% (lower mid). 3Y return: 20.28% (top quartile). 3Y return: 7.99% (upper mid). Point 7 1Y return: -3.27% (bottom quartile). 1Y return: -3.77% (bottom quartile). 1Y return: -0.98% (lower mid). 1Y return: 16.16% (top quartile). 1Y return: -0.87% (upper mid). Point 8 1M return: 2.22% (bottom quartile). 1M return: 2.15% (bottom quartile). 1M return: 2.29% (lower mid). 1M return: 3.68% (top quartile). 1M return: 2.32% (upper mid). Point 9 Alpha: -0.53 (upper mid). Alpha: -1.14 (bottom quartile). Alpha: -0.58 (lower mid). Alpha: -1.03 (bottom quartile). Alpha: -0.46 (top quartile). Point 10 Sharpe: -0.78 (bottom quartile). Sharpe: -0.81 (bottom quartile). Sharpe: -0.65 (lower mid). Sharpe: 1.04 (top quartile). Sharpe: -0.65 (upper mid). Nippon India Index Fund - Sensex Plan
LIC MF Index Fund Sensex
Franklin India Index Fund Nifty Plan
IDBI Nifty Index Fund
Nippon India Index Fund - Nifty Plan
છેલ્લા 1 મહિનાના આધારે શ્રેષ્ઠ મ્યુચ્યુઅલ ફંડ
(Erstwhile SBI IT Fund) To provide the investors maximum growth opportunity through equity
investments in stocks of growth oriented sectors of the economy. Below is the key information for SBI Technology Opportunities Fund Returns up to 1 year are on (Erstwhile Aditya Birla Sun Life New Millennium Fund) A multi-sector open-ended growth scheme with the objective of long term growth of capital, through a portfolio with a target allocation of 100% equity, focusing on investing in technology and technology dependent companies, hardware, peripherals and components, software, telecom, media, internet and e-commerce and other technology enabled companies. The secondary objective is income generation and distribution of dividend. Research Highlights for Aditya Birla Sun Life Digital India Fund Below is the key information for Aditya Birla Sun Life Digital India Fund Returns up to 1 year are on To generate long-term capital appreciation for you from a portfolio made up predominantly of equity and equity-related securities of technology intensive companies. Research Highlights for ICICI Prudential Technology Fund Below is the key information for ICICI Prudential Technology Fund Returns up to 1 year are on The investment objective of the scheme is to seek long term capital appreciation by investing atleast 80% of its net assets in equity/equity related instruments of the companies in Information Technology Sector in India.However, there is no assurance or guarantee that the investment objective of the Scheme will be achieved.The Scheme does not assure or guarantee any returns. Research Highlights for TATA Digital India Fund Below is the key information for TATA Digital India Fund Returns up to 1 year are on To provide long-term capital appreciation by predominantly investing in equity and equity related securities of technology and technology related companies. Research Highlights for Franklin India Technology Fund Below is the key information for Franklin India Technology Fund Returns up to 1 year are on 1. SBI Technology Opportunities Fund
SBI Technology Opportunities Fund
Growth Launch Date 9 Jan 13 NAV (30 Jul 26) ₹203.66 ↑ 1.01 (0.50 %) Net Assets (Cr) ₹4,018 on 30 Jun 26 Category Equity - Sectoral AMC SBI Funds Management Private Limited Rating ☆ Risk High Expense Ratio 1.91 Sharpe Ratio -1.34 Information Ratio 0.53 Alpha Ratio 1.96 Min Investment 5,000 Min SIP Investment 500 Exit Load 0-15 Days (0.5%),15 Days and above(NIL) Growth of 10,000 investment over the years.
Date Value 31 Jul 21 ₹10,000 31 Jul 22 ₹9,887 31 Jul 23 ₹11,042 31 Jul 24 ₹15,172 31 Jul 25 ₹15,542 31 Jul 26 ₹14,830 Returns for SBI Technology Opportunities Fund
absolute basis & more than 1 year are on CAGR (Compound Annual Growth Rate) basis. as on 30 Jul 26 Duration Returns 1 Month 14.9% 3 Month 9.3% 6 Month -7.8% 1 Year -4.2% 3 Year 10.9% 5 Year 8.3% 10 Year 15 Year Since launch 17.5% Historical performance (Yearly) on absolute basis
Year Returns 2024 1.5% 2023 30.1% 2022 24.8% 2021 -15.5% 2020 66.4% 2019 47.3% 2018 12.2% 2017 17.1% 2016 13% 2015 -3.3% Fund Manager information for SBI Technology Opportunities Fund
Name Since Tenure Vivek Gedda 1 Apr 24 2.25 Yr. Data below for SBI Technology Opportunities Fund as on 30 Jun 26
Equity Sector Allocation
Sector Value Technology 60.44% Communication Services 20.35% Consumer Cyclical 11.03% Financial Services 2.45% Industrials 1.99% Health Care 1.1% Consumer Defensive 0.39% Asset Allocation
Asset Class Value Cash 2.19% Equity 97.74% Debt 0.07% Top Securities Holdings / Portfolio
Name Holding Value Quantity Bharti Airtel Ltd (Communication Services)
Equity, Since 31 May 18 | BHARTIARTL13% ₹549 Cr 3,000,000 Infosys Ltd (Technology)
Equity, Since 31 Jan 03 | INFY12% ₹510 Cr 4,395,176 Tata Consultancy Services Ltd (Technology)
Equity, Since 30 Apr 06 | TCS8% ₹321 Cr 1,420,000 Eternal Ltd (Consumer Cyclical)
Equity, Since 31 Aug 24 | ETERNAL6% ₹266 Cr 10,600,000 Alphabet Inc Class A (Communication Services)
Equity, Since 31 Dec 23 | GOOGL5% ₹203 Cr 56,000 LTM Ltd (Technology)
Equity, Since 31 Oct 24 | LTM5% ₹203 Cr 500,000 Firstsource Solutions Ltd (Technology)
Equity, Since 31 Mar 23 | FSL5% ₹197 Cr 7,500,923 Cognizant Technology Solutions Corp Class A (Technology)
Equity, Since 31 Jul 23 | COZ4% ₹175 Cr 330,000 Coforge Ltd (Technology)
Equity, Since 31 Aug 23 | COFORGE4% ₹171 Cr 1,200,000 Microsoft Corp (Technology)
Equity, Since 31 Aug 20 | MSFT4% ₹163 Cr 38,000 2. Aditya Birla Sun Life Digital India Fund
Aditya Birla Sun Life Digital India Fund
Growth Launch Date 15 Jan 00 NAV (30 Jul 26) ₹158.66 ↓ -0.02 (-0.01 %) Net Assets (Cr) ₹3,589 on 30 Jun 26 Category Equity - Sectoral AMC Birla Sun Life Asset Management Co Ltd Rating ☆☆ Risk High Expense Ratio 1.88 Sharpe Ratio -1.27 Information Ratio -0.12 Alpha Ratio 3.86 Min Investment 1,000 Min SIP Investment 100 Exit Load 0-365 Days (1%),365 Days and above(NIL) Growth of 10,000 investment over the years.
Date Value 31 Jul 21 ₹10,000 31 Jul 22 ₹9,628 31 Jul 23 ₹10,858 31 Jul 24 ₹15,010 31 Jul 25 ₹13,808 31 Jul 26 ₹13,047 Returns for Aditya Birla Sun Life Digital India Fund
absolute basis & more than 1 year are on CAGR (Compound Annual Growth Rate) basis. as on 30 Jul 26 Duration Returns 1 Month 14.7% 3 Month 10.5% 6 Month -8.3% 1 Year -5.1% 3 Year 7% 5 Year 5.7% 10 Year 15 Year Since launch 11% Historical performance (Yearly) on absolute basis
Year Returns 2024 -5.2% 2023 18.1% 2022 35.8% 2021 -21.6% 2020 70.5% 2019 59% 2018 9.6% 2017 15.6% 2016 22.4% 2015 -3.5% Fund Manager information for Aditya Birla Sun Life Digital India Fund
Name Since Tenure Kunal Sangoi 16 Jan 14 12.46 Yr. Data below for Aditya Birla Sun Life Digital India Fund as on 30 Jun 26
Equity Sector Allocation
Sector Value Technology 64.58% Consumer Cyclical 10.87% Communication Services 10.56% Industrials 4.85% Financial Services 3.53% Consumer Defensive 0.88% Asset Allocation
Asset Class Value Cash 0.65% Equity 96.09% Other 3.25% Top Securities Holdings / Portfolio
Name Holding Value Quantity Infosys Ltd (Technology)
Equity, Since 30 Apr 05 | INFY15% ₹577 Cr 4,967,365 Bharti Airtel Ltd (Communication Services)
Equity, Since 31 Aug 19 | BHARTIARTL9% ₹355 Cr 1,939,969
↓ -169,415 Tech Mahindra Ltd (Technology)
Equity, Since 31 May 13 | TECHM8% ₹313 Cr 2,111,995
↓ -83,586 Tata Consultancy Services Ltd (Technology)
Equity, Since 30 Apr 05 | TCS7% ₹273 Cr 1,208,815 Eternal Ltd (Consumer Cyclical)
Equity, Since 31 Jul 21 | ETERNAL6% ₹241 Cr 9,604,831 Coforge Ltd (Technology)
Equity, Since 30 Jun 20 | COFORGE5% ₹184 Cr 1,296,695 LTM Ltd (Technology)
Equity, Since 31 Mar 21 | LTM5% ₹176 Cr 434,328
↑ 24,254 Persistent Systems Ltd (Technology)
Equity, Since 31 Jul 13 | PERSISTENT4% ₹162 Cr 311,131 Swiggy Ltd (Consumer Cyclical)
Equity, Since 30 Nov 24 | SWIGGY3% ₹132 Cr 5,119,802 HCL Technologies Ltd (Technology)
Equity, Since 31 Dec 10 | HCLTECH3% ₹130 Cr 1,095,274 3. ICICI Prudential Technology Fund
ICICI Prudential Technology Fund
Growth Launch Date 3 Mar 00 NAV (30 Jul 26) ₹183.25 ↓ -0.43 (-0.23 %) Net Assets (Cr) ₹12,547 on 30 Jun 26 Category Equity - Sectoral AMC ICICI Prudential Asset Management Company Limited Rating ☆☆ Risk High Expense Ratio 1.75 Sharpe Ratio -1.35 Information Ratio 0.5 Alpha Ratio 2.29 Min Investment 5,000 Min SIP Investment 100 Exit Load 0-1 Years (1%),1 Years and above(NIL) Growth of 10,000 investment over the years.
Date Value 31 Jul 21 ₹10,000 31 Jul 22 ₹9,577 31 Jul 23 ₹10,271 31 Jul 24 ₹14,535 31 Jul 25 ₹13,983 31 Jul 26 ₹13,041 Returns for ICICI Prudential Technology Fund
absolute basis & more than 1 year are on CAGR (Compound Annual Growth Rate) basis. as on 30 Jul 26 Duration Returns 1 Month 13.1% 3 Month 7.9% 6 Month -10.2% 1 Year -6.8% 3 Year 8.8% 5 Year 5.6% 10 Year 15 Year Since launch 11.6% Historical performance (Yearly) on absolute basis
Year Returns 2024 -1.9% 2023 25.4% 2022 27.5% 2021 -23.2% 2020 75.7% 2019 70.6% 2018 2.3% 2017 19.1% 2016 19.8% 2015 -4% Fund Manager information for ICICI Prudential Technology Fund
Name Since Tenure Vaibhav Dusad 2 May 20 6.16 Yr. Sharmila D’mello 30 Jun 22 4 Yr. Data below for ICICI Prudential Technology Fund as on 30 Jun 26
Equity Sector Allocation
Sector Value Technology 59.14% Communication Services 17.81% Consumer Cyclical 5.21% Health Care 3.44% Industrials 3.21% Financial Services 2.45% Real Estate 0.96% Consumer Defensive 0.63% Asset Allocation
Asset Class Value Cash 4.12% Equity 95.88% Top Securities Holdings / Portfolio
Name Holding Value Quantity Infosys Ltd (Technology)
Equity, Since 30 Apr 08 | INFY13% ₹1,786 Cr 15,386,043
↓ -200,000 Bharti Airtel Ltd (Communication Services)
Equity, Since 31 May 20 | BHARTIARTL12% ₹1,632 Cr 8,921,863
↑ 213,702 Tech Mahindra Ltd (Technology)
Equity, Since 31 Oct 16 | TECHM8% ₹1,133 Cr 7,638,323
↑ 849,573 Mphasis Ltd (Technology)
Equity, Since 30 Jun 20 | MPHASIS4% ₹578 Cr 2,544,820
↑ 223,427 Coforge Ltd (Technology)
Equity, Since 31 Jul 20 | COFORGE4% ₹523 Cr 3,675,400 Cognizant Technology Solutions Corp Class A (Technology)
Equity, Since 31 Jul 21 | COZ3% ₹410 Cr 771,638 Wipro Ltd. $$
Derivatives, Since 31 May 26 | 5076853% ₹405 Cr 21,531,000
↓ -11,523,000 LTM Ltd (Technology)
Equity, Since 31 Jul 16 | LTM3% ₹401 Cr 987,079
↑ 235,950 Sagility Ltd (Healthcare)
Equity, Since 30 Nov 24 | SAGILITY2% ₹289 Cr 70,479,558
↑ 5,566,869 Persistent Systems Ltd (Technology)
Equity, Since 31 May 20 | PERSISTENT2% ₹268 Cr 516,867
↑ 120,838 4. TATA Digital India Fund
TATA Digital India Fund
Growth Launch Date 28 Dec 15 NAV (31 Jul 26) ₹41.9522 ↓ -0.44 (-1.03 %) Net Assets (Cr) ₹9,196 on 30 Jun 26 Category Equity - Sectoral AMC Tata Asset Management Limited Rating Risk High Expense Ratio 1.68 Sharpe Ratio -1.44 Information Ratio 0.82 Alpha Ratio 0.38 Min Investment 5,000 Min SIP Investment 150 Exit Load 0-3 Months (0.25%),3 Months and above(NIL) Growth of 10,000 investment over the years.
Date Value 31 Jul 21 ₹10,000 31 Jul 22 ₹9,795 31 Jul 23 ₹10,595 31 Jul 24 ₹15,442 31 Jul 25 ₹14,196 31 Jul 26 ₹12,971 Returns for TATA Digital India Fund
absolute basis & more than 1 year are on CAGR (Compound Annual Growth Rate) basis. as on 30 Jul 26 Duration Returns 1 Month 11.8% 3 Month 7.3% 6 Month -12.1% 1 Year -8.6% 3 Year 7% 5 Year 5.3% 10 Year 15 Year Since launch 14.5% Historical performance (Yearly) on absolute basis
Year Returns 2024 -9.7% 2023 30.6% 2022 31.9% 2021 -23.3% 2020 74.4% 2019 54.8% 2018 7.5% 2017 24.9% 2016 19.6% 2015 -6% Fund Manager information for TATA Digital India Fund
Name Since Tenure Meeta Shetty 9 Mar 21 5.31 Yr. Hasmukh Vishariya 1 Mar 25 1.33 Yr. Data below for TATA Digital India Fund as on 30 Jun 26
Equity Sector Allocation
Sector Value Technology 65.17% Consumer Cyclical 9.98% Communication Services 6.71% Industrials 5.85% Financial Services 3.94% Utility 1.14% Consumer Defensive 0.11% Asset Allocation
Asset Class Value Cash 9.07% Equity 90.93% Top Securities Holdings / Portfolio
Name Holding Value Quantity Infosys Ltd (Technology)
Equity, Since 31 Jan 16 | INFY17% ₹1,679 Cr 14,461,819 Tata Consultancy Services Ltd (Technology)
Equity, Since 31 Jan 16 | TCS11% ₹1,110 Cr 4,914,144 Tech Mahindra Ltd (Technology)
Equity, Since 30 Apr 16 | TECHM9% ₹907 Cr 6,110,933 Eternal Ltd (Consumer Cyclical)
Equity, Since 31 Oct 22 | ETERNAL5% ₹511 Cr 20,395,000 Bharti Airtel Ltd (Communication Services)
Equity, Since 31 Oct 21 | BHARTIARTL5% ₹470 Cr 2,569,200
↑ 200,000 Wipro Ltd (Technology)
Equity, Since 31 Jul 18 | WIPRO4% ₹385 Cr 18,859,040
↓ -2,528,284 HCL Technologies Ltd (Technology)
Equity, Since 31 Jan 16 | HCLTECH4% ₹367 Cr 3,098,559 PB Fintech Ltd (Financial Services)
Equity, Since 31 Dec 22 | 5433903% ₹327 Cr 1,919,524 Persistent Systems Ltd (Technology)
Equity, Since 31 Jan 16 | PERSISTENT3% ₹310 Cr 596,031 Firstsource Solutions Ltd (Technology)
Equity, Since 30 Nov 21 | FSL2% ₹198 Cr 7,540,028
↓ -1,220,000 5. Franklin India Technology Fund
Franklin India Technology Fund
Growth Launch Date 22 Aug 98 NAV (30 Jul 26) ₹479.934 ↓ -0.11 (-0.02 %) Net Assets (Cr) ₹1,583 on 30 Jun 26 Category Equity - Sectoral AMC Franklin Templeton Asst Mgmt(IND)Pvt Ltd Rating ☆ Risk High Expense Ratio 2.08 Sharpe Ratio -1.37 Information Ratio 0.77 Alpha Ratio 0.33 Min Investment 5,000 Min SIP Investment 500 Exit Load 0-1 Years (1%),1 Years and above(NIL) Growth of 10,000 investment over the years.
Date Value 31 Jul 21 ₹10,000 31 Jul 22 ₹9,087 31 Jul 23 ₹11,013 31 Jul 24 ₹16,747 31 Jul 25 ₹16,090 31 Jul 26 ₹15,122 Returns for Franklin India Technology Fund
absolute basis & more than 1 year are on CAGR (Compound Annual Growth Rate) basis. as on 30 Jul 26 Duration Returns 1 Month 10.9% 3 Month 7.3% 6 Month -7.9% 1 Year -6% 3 Year 11.6% 5 Year 8.7% 10 Year 15 Year Since launch 17.7% Historical performance (Yearly) on absolute basis
Year Returns 2024 -1.5% 2023 28.4% 2022 51.1% 2021 -22.3% 2020 39% 2019 56.8% 2018 12.4% 2017 11.9% 2016 19.1% 2015 -2.6% Fund Manager information for Franklin India Technology Fund
Name Since Tenure Venkatesh Sanjeevi 4 Oct 24 1.74 Yr. R. Janakiraman 1 Dec 23 2.58 Yr. Sandeep Manam 18 Oct 21 4.7 Yr. Data below for Franklin India Technology Fund as on 30 Jun 26
Equity Sector Allocation
Sector Value Technology 49.67% Communication Services 25.9% Consumer Cyclical 14.75% Financial Services 5.39% Health Care 0.04% Industrials 0.01% Asset Allocation
Asset Class Value Cash 3.79% Equity 95.84% Other 0.14% Top Securities Holdings / Portfolio
Name Holding Value Quantity Bharti Airtel Ltd (Communication Services)
Equity, Since 31 Jan 18 | BHARTIARTL19% ₹321 Cr 1,752,677
↑ 121,180 Infosys Ltd (Technology)
Equity, Since 29 Feb 12 | INFY15% ₹243 Cr 2,089,607 Franklin Technology I Acc USD
Investment Fund | -8% ₹138 Cr 124,810 Eternal Ltd (Consumer Cyclical)
Equity, Since 31 Jul 21 | ETERNAL7% ₹113 Cr 4,524,577 HCL Technologies Ltd (Technology)
Equity, Since 30 Jun 14 | HCLTECH6% ₹106 Cr 894,643 PB Fintech Ltd (Financial Services)
Equity, Since 30 Nov 21 | 5433905% ₹88 Cr 517,479 Tata Consultancy Services Ltd (Technology)
Equity, Since 31 Aug 04 | TCS5% ₹85 Cr 378,126 Cognizant Technology Solutions Corp Class A (Technology)
Equity, Since 30 Sep 25 | CTSH5% ₹84 Cr 159,240 Amagi Media Labs Ltd (Technology)
Equity, Since 31 Jan 26 | AMAGI3% ₹44 Cr 1,108,025 Info Edge (India) Ltd (Communication Services)
Equity, Since 31 Jan 17 | NAUKRI2% ₹39 Cr 394,359
લમ્પ સમ ઇન્વેસ્ટમેન્ટ દરમિયાન ધ્યાનમાં રાખવા જેવી બાબતો
મ્યુચ્યુઅલ ફંડમાં રોકાણ કરતા પહેલા વ્યક્તિઓએ ઘણાં પરિમાણોનું ધ્યાન રાખવું જરૂરી છે. તે પણ સમાવેશ થાય:
બજારનો સમય
જ્યારે એકસાથે રોકાણની વાત આવે છે, ત્યારે વ્યક્તિઓએ હંમેશા તેની શોધ કરવાની જરૂર છેબજાર ખાસ કરીને ઇક્વિટી-આધારિત ભંડોળના સંદર્ભમાં સમય. એકસાથે રોકાણ કરવાનો સારો સમય એ છે કે જ્યારે બજારો નીચા હોય અને એવી અવકાશ હોય છે કે તેઓ ટૂંક સમયમાં પ્રશંસા કરવાનું શરૂ કરશે. જો કે, જો બજારો પહેલેથી જ ટોચ પર હોય તો, એકમ રોકાણથી દૂર રહેવું વધુ સારું છે.
વૈવિધ્યકરણ
વૈવિધ્યકરણ એ પણ એક મહત્વપૂર્ણ પાસું છે જેને એકસાથે રોકાણ કરતા પહેલા ધ્યાનમાં લેવાની જરૂર છે. એકસામટી રોકાણના કિસ્સામાં વ્યક્તિઓએ તેમના રોકાણને બહુવિધ માર્ગોમાં ફેલાવીને વૈવિધ્યીકરણ કરવું જોઈએ. આ સુનિશ્ચિત કરવામાં મદદ કરશે કે તેમનો એકંદર પોર્ટફોલિયો સારો દેખાવ કરે છે, પછી ભલે તે યોજનાઓમાંથી એક કાર્ય ન કરે.
તમારા ઉદ્દેશ્ય મુજબ તમારું રોકાણ કરો
વ્યક્તિઓ કરે છે તે કોઈપણ રોકાણ ચોક્કસ ઉદ્દેશ્યને પ્રાપ્ત કરવા માટે છે. તેથી, વ્યક્તિઓએ તપાસ કરવી જોઈએ કે શું યોજનાનો અભિગમ સાથે સુસંગત છેરોકાણકારનો ઉદ્દેશ્ય. અહીં, વ્યક્તિઓએ વિવિધ પરિમાણો માટે જોવું જોઈએ જેમ કેCAGR યોજનામાં રોકાણ કરતા પહેલા વળતર, સંપૂર્ણ વળતર, કરવેરાની અસર અને ઘણું બધું.
રિડેમ્પશન સાચા સમયે થવું જોઈએ
વ્યક્તિઓએ તેમનું કરવું જોઈએવિમોચન એકસાથે રોકાણમાં યોગ્ય સમયે. જો કે તે હજુ સુધી રોકાણના ઉદ્દેશ્ય મુજબ હોઈ શકે છે; વ્યક્તિઓએ જે સ્કીમમાં રોકાણ કરવાની યોજના બનાવી છે તેની સમયસર સમીક્ષા કરવી જોઈએ. જો કે, તેઓએ તેમના રોકાણને લાંબા સમય સુધી રાખવાની પણ જરૂર છે જેથી કરીને તેઓ મહત્તમ લાભોનો આનંદ માણી શકે.
મ્યુચ્યુઅલ ફંડ લમ્પ સમ રિટર્ન કેલ્ક્યુલેટર
મ્યુચ્યુઅલ ફંડ લમ્પ સમ રિટર્ન કેલ્ક્યુલેટર વ્યક્તિઓને એ બતાવવામાં મદદ કરે છે કે આપેલ સમયમર્યાદામાં વ્યક્તિનું એકસાથે રોકાણ કેવી રીતે વધે છે. એકીકૃત કેલ્ક્યુલેટરમાં ઇનપુટ કરવાની જરૂર હોય તેવા કેટલાક ડેટામાં રોકાણનો કાર્યકાળ, પ્રારંભિક રોકાણની રકમ, લાંબા ગાળાની અપેક્ષિત વૃદ્ધિ દર અને ઘણું બધું સામેલ છે. મ્યુચ્યુઅલ ફંડ લમ્પ સમ રિટર્ન કેલ્ક્યુલેટરનું ઉદાહરણ નીચે મુજબ છે.
ઉદાહરણ
એકસાથે રોકાણ: 25 રૂપિયા,000
રોકાણનો સમયગાળો: 15 વર્ષ
લાંબા ગાળાનો વિકાસ દર (અંદાજે): 15%
લમ્પ સમ કેલ્ક્યુલેટર મુજબ અપેક્ષિત વળતર: INR 2,03,427
રોકાણ પર ચોખ્ખો નફો: INR 1,78,427
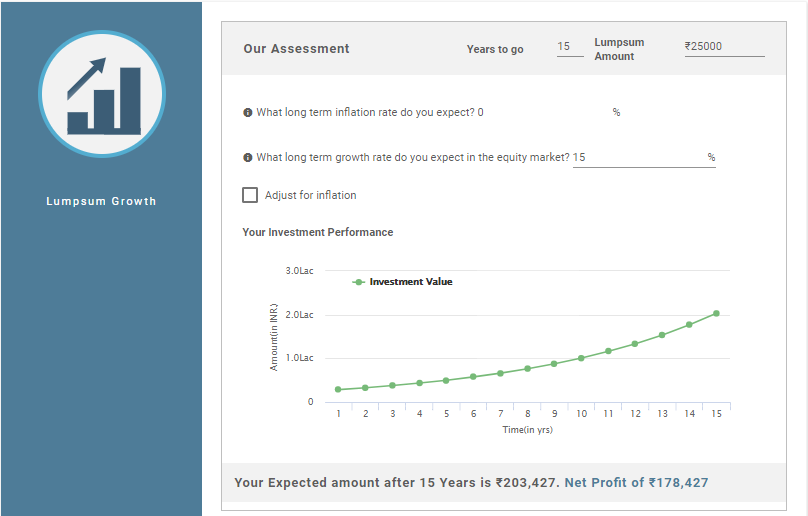
આમ, ઉપરોક્ત ગણતરી દર્શાવે છે કે તમારા રોકાણ પરના રોકાણ પરનો ચોખ્ખો નફો INR 1,78,427 છે જ્યારે તમારા રોકાણનું કુલ મૂલ્ય INR 2,03,427 છે..
મ્યુચ્યુઅલ ફંડમાં વન-ટાઇમ રોકાણના ફાયદા અને ગેરફાયદા
SIP ની જેમ જ, લમ્પ સમ ઇન્વેસ્ટમેન્ટમાં પણ તેના પોતાના ફાયદા અને ગેરફાયદા છે. તો ચાલો જોઈએ આ ફાયદા અને ગેરફાયદા.
ફાયદા
લમ્પ સમ રોકાણના ફાયદા નીચે મુજબ છે.
- મોટી રકમનું રોકાણ કરો: વ્યક્તિઓ મ્યુચ્યુઅલ ફંડમાં મોટી રકમનું રોકાણ કરી શકે છે અને ફંડને નિષ્ક્રિય રાખવાને બદલે વધુ વળતર મેળવી શકે છે.
- લાંબા ગાળા માટે આદર્શ: રોકાણનો લમ્પ સમ મોડ લાંબા ગાળાના રોકાણો માટે સારો છે, ખાસ કરીને ઇક્વિટી ફંડ્સના કિસ્સામાં. જો કે, ડેટ ફંડના કિસ્સામાં, કાર્યકાળ ટૂંકા અથવા મધ્યમ ગાળાનો હોઈ શકે છે
- સગવડ: રોકાણનો એકસામટો મોડ અનુકૂળ છે કારણ કે ચુકવણી માત્ર એક જ વાર કરવામાં આવે છે અને નિયમિત અંતરાલે કાપવામાં આવતી નથી.
ગેરફાયદા
લમ્પ સમ રોકાણના ગેરફાયદા છે:
- અનિયમિત રોકાણ: લમ્પ સમ રોકાણ રોકાણકારની નિયમિત બચતને સુનિશ્ચિત કરતું નથી કારણ કે તે નિયમિત બચતની આદત પેદા કરતું નથી.
- ઉચ્ચ જોખમ: લમ્પ સમ રોકાણમાં, સમય જોવો મહત્વપૂર્ણ છે. આનું કારણ એ છે કે લમ્પ સમ મોડમાં રોકાણ માત્ર એક જ વાર કરવામાં આવે છે અને નિયમિત અંતરાલે નહીં. તેથી, જો વ્યક્તિઓ સમયને ધ્યાનમાં લેતા નથી, તો તેઓને નુકસાન થઈ શકે છે.
નિષ્કર્ષ
આમ, ઉપરોક્ત નિર્દેશો પરથી, એવું કહી શકાય કે મ્યુચ્યુઅલ ફંડ્સમાં રોકાણ કરવાની લમ્પ સમ મોડ પણ સારી રીત છે. જો કે, સ્કીમમાં એકમ રકમનું રોકાણ કરતી વખતે વ્યક્તિઓએ આત્મવિશ્વાસ રાખવાની જરૂર છે. જો નહીં, તો તેઓ રોકાણનો SIP મોડ પસંદ કરી શકે છે. વધુમાં, લોકોએ રોકાણ કરતા પહેલા સ્કીમની રીતભાતને સમજવી જોઈએ. જો જરૂરી હોય તો, તેઓ એનો સંપર્ક પણ કરી શકે છેનાણાંકીય સલાહકાર. આ તેમને ખાતરી કરવામાં મદદ કરશે કે તેમના નાણાં સુરક્ષિત છે અને તેમના ઉદ્દેશ્યો સમયસર પૂરા થાય છે.
અહીં આપેલી માહિતી સચોટ છે તેની ખાતરી કરવા માટેના તમામ પ્રયાસો કરવામાં આવ્યા છે. જો કે, ડેટાની શુદ્ધતા અંગે કોઈ ગેરંટી આપવામાં આવતી નથી. કોઈપણ રોકાણ કરતા પહેલા કૃપા કરીને સ્કીમ માહિતી દસ્તાવેજ સાથે ચકાસો.
You Might Also Like


AMFI Registration No. 112358 | CIN: U74999MH2016PTC282153
Shepard Technologies Pvt. Ltd. (with ARN code 112358) makes no warranties or representations, express or implied, on products offered through the platform. It accepts no liability for any damages or losses, however caused, in connection with the use of, or on the reliance of its product or related services. Terms and conditions of the website are applicable.
©2026 Shepard Technologies Private Limited. All Rights Reserved
Research Highlights for SBI Technology Opportunities Fund