 +91-22-48913909
Table of Contents
- Why Invest in Top 11 SIP Funds?
- How to Invest in SIP?
- Top 11 SIP Mutual Funds in India FY 25 - 26
- Parameters to Consider While Investing in Best Systematic Investment Plans
- How to Invest in SIP MF Online?
- FAQs
Top 11 Funds
- ICICI Prudential Infrastructure Fund
- HDFC Infrastructure Fund
- L&T Emerging Businesses Fund
- IDFC Infrastructure Fund
- Franklin India Smaller Companies Fund
- DSP BlackRock India T.I.G.E.R Fund
- Edelweiss Mid Cap Fund
- Franklin Build India Fund
- LIC MF Infrastructure Fund
- Nippon India Power and Infra Fund
- ICICI Prudential Smallcap Fund
11 Best Mutual Funds for SIP 2025
SIP Mutual Funds (or top 11 SIP Mutual Funds) are funds that adhere to the simple formula of periodic investment to avoid nervous selling during the inevitable ups and downs of the stock market.
Typically, SIP or Systematic Investment plan is a mode to invest money in Mutual Funds. Investing in top 11 SIP Mutual Funds brings a systematic and disciplined approach to your investment. It reduces your effort to manage your investment on daily Basis. Moreover, it offers leverage of the Power of Compounding leading to desired returns over time.

There are different Types of Mutual Funds for SIP that include equity, debt, balanced, ultra-short term funds, etc. However, equity Mutual Funds offer maximum returns when invested via a SIP. Financial advisors suggest that, the investors must invest in best mutual funds for SIP basis their investment objectives and the period of SIP investment.
Why Invest in Top 11 SIP Funds?
SIPs give a disciplined approach towards investing in Mutual Funds
Systematic investing helps in financing the future dream and major goals like- retirement, child's career, purchase of a house, car or any other assets
SIPs help in making the most of compounding and are ideal for young investors
Systematic Investment Plans minimize the risk of equity fluctuations
How to Invest in SIP?
Investing money is an art, it can work wonders if done correctly. Now that you know the Top SIP plans you must know how to invest in it. We have mentioned the steps to invest in SIP below.
1. Analyse your financial goals
Choose a SIP investment suiting your Financial goals. For example, if your goal is short-term (if want to buy a car in the next 2 years), you should invest in Debt Mutual Funds. And, if your goal is long-term (like Retirement planning) then prefer investing in Equity Mutual Funds.
2. Choose a timeline of investment
This will ensure that you invest a right amount of money for a right period of time.
3. Decide the amount you wish to invest monthly
As SIP is a monthly investment, you should choose an amount that you will be able to invest monthly without Fail. You can also calculate the suitable amount as per your goal using sip calculator or SIP return calculator.
4. Select the best SIP plan
Make a wise investment choice by consulting a financial advisor or by choosing Best SIP Plans offered by various online investment platforms.
Talk to our investment specialist
Top 11 SIP Mutual Funds in India FY 25 - 26
To generate capital appreciation and income distribution to unit holders by investing predominantly in equity/equity related securities of the companies belonging to the infrastructure development and balance in debt securities and money market instruments. ICICI Prudential Infrastructure Fund is a Equity - Sectoral fund was launched on 31 Aug 05. It is a fund with High risk and has given a Below is the key information for ICICI Prudential Infrastructure Fund Returns up to 1 year are on To seek long-term capital appreciation by investing predominantly in equity and equity related securities of companies engaged in or expected to benefit from growth and development of infrastructure. HDFC Infrastructure Fund is a Equity - Sectoral fund was launched on 10 Mar 08. It is a fund with High risk and has given a Below is the key information for HDFC Infrastructure Fund Returns up to 1 year are on To generate long-term capital appreciation from a diversified portfolio of predominantly equity and equity related securities, including equity derivatives, in the Indian markets with key theme focus being emerging companies (small cap stocks). The Scheme could also additionally invest in Foreign Securities. L&T Emerging Businesses Fund is a Equity - Small Cap fund was launched on 12 May 14. It is a fund with High risk and has given a Below is the key information for L&T Emerging Businesses Fund Returns up to 1 year are on The investment objective of the scheme is to seek to generate long-term capital growth through an active diversified portfolio of predominantly equity and equity related instruments of companies that are participating in and benefiting from growth in Indian infrastructure and infrastructural related activities. However, there can be no assurance that the investment objective of the scheme will be realized. IDFC Infrastructure Fund is a Equity - Sectoral fund was launched on 8 Mar 11. It is a fund with High risk and has given a Below is the key information for IDFC Infrastructure Fund Returns up to 1 year are on The Fund seeks to provide long-term capital appreciation by investing in mid and small cap companies. Franklin India Smaller Companies Fund is a Equity - Small Cap fund was launched on 13 Jan 06. It is a fund with Moderately High risk and has given a Below is the key information for Franklin India Smaller Companies Fund Returns up to 1 year are on To generate capital appreciation, from a portfolio that is substantially constituted of equity securities and equity related securities of corporates, which could benefit from structural changes brought about by continuing liberalization in economic policies by the government and/or continuing investments in infrastructure, both by the public and private sector. DSP BlackRock India T.I.G.E.R Fund is a Equity - Sectoral fund was launched on 11 Jun 04. It is a fund with High risk and has given a Below is the key information for DSP BlackRock India T.I.G.E.R Fund Returns up to 1 year are on (Erstwhile Edelweiss Mid and Small Cap Fund ) The investment objective is to seek to generate long-term capital appreciation from a portfolio that predominantly invests in equity and equity-related securities of Mid Cap companies.
However, there can be no assurance that the investment objective of the Scheme will be realised. Edelweiss Mid Cap Fund is a Equity - Mid Cap fund was launched on 26 Dec 07. It is a fund with High risk and has given a Below is the key information for Edelweiss Mid Cap Fund Returns up to 1 year are on The Scheme seeks to achieve capital appreciation by investing in companies engaged directly or indirectly in infrastructure related activities. Franklin Build India Fund is a Equity - Sectoral fund was launched on 4 Sep 09. It is a fund with High risk and has given a Below is the key information for Franklin Build India Fund Returns up to 1 year are on The investment objective of the scheme is to provide long term growth from a portfolio of equity / equity related instruments of companies engaged either directly or indirectly in the infrastructure sector. LIC MF Infrastructure Fund is a Equity - Sectoral fund was launched on 29 Feb 08. It is a fund with High risk and has given a Below is the key information for LIC MF Infrastructure Fund Returns up to 1 year are on (Erstwhile Reliance Diversified Power Sector Fund) The primary investment objective of the scheme is to generate long term capital appreciation by investing predominantly in equity and equity related securities of companies in the power sector. Nippon India Power and Infra Fund is a Equity - Sectoral fund was launched on 8 May 04. It is a fund with High risk and has given a Below is the key information for Nippon India Power and Infra Fund Returns up to 1 year are on (Erstwhile ICICI Prudential Indo Asia Equity Fund) ICICI Prudential Indo Asia Equity Fund is an OE equity scheme that seeks to generate long term capital appreciation by investing in equity, equity related securities and or share classes/units of equity funds of companies, which are incorporated or have their area of primary activity, in the Asia Pacific region. Initially the Scheme will invest in share classes of International Opportunities Fund Asian Equity Fund and thereafter the Fund Manager of the Indo Asia Equity Fund may choose to make investment in listed equity shares, securities in the Asia Pacific region. However, there can be no assurance that the investment objective of the Scheme will be realized. ICICI Prudential Smallcap Fund is a Equity - Small Cap fund was launched on 18 Oct 07. It is a fund with Moderately High risk and has given a Below is the key information for ICICI Prudential Smallcap Fund Returns up to 1 year are on Fund NAV Net Assets (Cr) Min SIP Investment 3 MO (%) 6 MO (%) 1 YR (%) 3 YR (%) 5 YR (%) 2024 (%) ICICI Prudential Infrastructure Fund Growth ₹199.56
↑ 0.23 ₹7,920 100 12.5 7.2 4.8 36.1 38 27.4 HDFC Infrastructure Fund Growth ₹48.415
↑ 0.05 ₹2,540 300 12 3.5 -0.3 36.6 35.3 23 L&T Emerging Businesses Fund Growth ₹83.7549
↓ -0.22 ₹16,061 500 16 -6.3 -2.5 26.9 35.2 28.5 IDFC Infrastructure Fund Growth ₹52.046
↓ -0.12 ₹1,701 100 13.5 -0.3 -5.3 35.7 35 39.3 Franklin India Smaller Companies Fund Growth ₹175.725
↓ -0.01 ₹13,545 500 16.2 -2.8 -3.7 30.2 34.7 23.2 DSP BlackRock India T.I.G.E.R Fund Growth ₹320.139
↑ 1.05 ₹5,319 500 13 -1.3 -4 33.8 34.5 32.4 Edelweiss Mid Cap Fund Growth ₹103.436
↓ -0.28 ₹10,028 500 16.9 2.4 10 31.9 33.8 38.9 Franklin Build India Fund Growth ₹143.513
↑ 0.39 ₹2,857 500 11.9 3.1 -0.2 34.7 33.7 27.8 LIC MF Infrastructure Fund Growth ₹50.7897
↑ 0.01 ₹1,005 1,000 17.2 -1.8 0.5 34.2 33.5 47.8 Nippon India Power and Infra Fund Growth ₹353.655
↑ 0.99 ₹7,417 100 12.2 1.3 -5 37 33.5 26.9 ICICI Prudential Smallcap Fund Growth ₹88.7
↑ 0.13 ₹8,254 100 15.2 2.5 -0.2 22.4 33.2 15.6 Note: Returns up to 1 year are on absolute basis & more than 1 year are on CAGR basis. as on 1 Jul 25 200 Crore in Equity Category of mutual funds ordered based on 5 year calendar year returns.
1. ICICI Prudential Infrastructure Fund
CAGR/Annualized return of 16.3% since its launch. Ranked 27 in Sectoral category. Return for 2024 was 27.4% , 2023 was 44.6% and 2022 was 28.8% . ICICI Prudential Infrastructure Fund
Growth Launch Date 31 Aug 05 NAV (01 Jul 25) ₹199.56 ↑ 0.23 (0.12 %) Net Assets (Cr) ₹7,920 on 31 May 25 Category Equity - Sectoral AMC ICICI Prudential Asset Management Company Limited Rating ☆☆☆ Risk High Expense Ratio 2.22 Sharpe Ratio 0.15 Information Ratio 0 Alpha Ratio 0 Min Investment 5,000 Min SIP Investment 100 Exit Load 0-1 Years (1%),1 Years and above(NIL) Growth of 10,000 investment over the years.
Date Value 30 Jun 20 ₹10,000 30 Jun 21 ₹17,499 30 Jun 22 ₹20,184 30 Jun 23 ₹28,605 30 Jun 24 ₹47,767 30 Jun 25 ₹50,298 Returns for ICICI Prudential Infrastructure Fund
absolute basis & more than 1 year are on CAGR (Compound Annual Growth Rate) basis. as on 1 Jul 25 Duration Returns 1 Month 3.4% 3 Month 12.5% 6 Month 7.2% 1 Year 4.8% 3 Year 36.1% 5 Year 38% 10 Year 15 Year Since launch 16.3% Historical performance (Yearly) on absolute basis
Year Returns 2024 27.4% 2023 44.6% 2022 28.8% 2021 50.1% 2020 3.6% 2019 2.6% 2018 -14% 2017 40.8% 2016 2% 2015 -3.4% Fund Manager information for ICICI Prudential Infrastructure Fund
Name Since Tenure Ihab Dalwai 3 Jun 17 8 Yr. Sharmila D’mello 30 Jun 22 2.92 Yr. Data below for ICICI Prudential Infrastructure Fund as on 31 May 25
Equity Sector Allocation
Sector Value Industrials 40.97% Basic Materials 16.41% Financial Services 15.57% Utility 8.44% Energy 6.25% Real Estate 3.35% Communication Services 1.59% Consumer Cyclical 0.92% Asset Allocation
Asset Class Value Cash 6.4% Equity 93.51% Other 0.09% Top Securities Holdings / Portfolio
Name Holding Value Quantity Larsen & Toubro Ltd (Industrials)
Equity, Since 30 Nov 09 | LT10% ₹783 Cr 2,130,204
↓ -30,000 Adani Ports & Special Economic Zone Ltd (Industrials)
Equity, Since 31 May 24 | ADANIPORTS4% ₹354 Cr 2,468,659
↓ -47,200 NCC Ltd (Industrials)
Equity, Since 31 Aug 21 | NCC4% ₹289 Cr 12,522,005 NTPC Ltd (Utilities)
Equity, Since 29 Feb 16 | NTPC3% ₹254 Cr 7,600,000
↑ 1,200,000 Reliance Industries Ltd (Energy)
Equity, Since 31 Jul 23 | RELIANCE3% ₹236 Cr 1,662,727 Vedanta Ltd (Basic Materials)
Equity, Since 31 Jul 24 | VEDL3% ₹228 Cr 5,223,662 JM Financial Ltd (Financial Services)
Equity, Since 31 Oct 21 | JMFINANCIL3% ₹227 Cr 17,763,241 Kalpataru Projects International Ltd (Industrials)
Equity, Since 30 Sep 06 | KPIL3% ₹217 Cr 1,903,566 ICICI Bank Ltd (Financial Services)
Equity, Since 31 Dec 16 | ICICIBANK3% ₹206 Cr 1,425,000 Shree Cement Ltd (Basic Materials)
Equity, Since 30 Apr 24 | SHREECEM2% ₹195 Cr 66,000
↓ -9,408 2. HDFC Infrastructure Fund
CAGR/Annualized return of since its launch. Ranked 26 in Sectoral category. Return for 2024 was 23% , 2023 was 55.4% and 2022 was 19.3% . HDFC Infrastructure Fund
Growth Launch Date 10 Mar 08 NAV (01 Jul 25) ₹48.415 ↑ 0.05 (0.11 %) Net Assets (Cr) ₹2,540 on 31 May 25 Category Equity - Sectoral AMC HDFC Asset Management Company Limited Rating ☆☆☆ Risk High Expense Ratio 2.31 Sharpe Ratio -0.02 Information Ratio 0 Alpha Ratio 0 Min Investment 5,000 Min SIP Investment 300 Exit Load 0-1 Years (1%),1 Years and above(NIL) Growth of 10,000 investment over the years.
Date Value 30 Jun 20 ₹10,000 30 Jun 21 ₹17,250 30 Jun 22 ₹18,065 30 Jun 23 ₹25,910 30 Jun 24 ₹45,550 30 Jun 25 ₹45,892 Returns for HDFC Infrastructure Fund
absolute basis & more than 1 year are on CAGR (Compound Annual Growth Rate) basis. as on 1 Jul 25 Duration Returns 1 Month 2.2% 3 Month 12% 6 Month 3.5% 1 Year -0.3% 3 Year 36.6% 5 Year 35.3% 10 Year 15 Year Since launch Historical performance (Yearly) on absolute basis
Year Returns 2024 23% 2023 55.4% 2022 19.3% 2021 43.2% 2020 -7.5% 2019 -3.4% 2018 -29% 2017 43.3% 2016 -1.9% 2015 -2.5% Fund Manager information for HDFC Infrastructure Fund
Name Since Tenure Srinivasan Ramamurthy 12 Jan 24 1.39 Yr. Dhruv Muchhal 22 Jun 23 1.95 Yr. Data below for HDFC Infrastructure Fund as on 31 May 25
Equity Sector Allocation
Sector Value Industrials 39.5% Financial Services 20.04% Basic Materials 11.19% Utility 6.94% Energy 6.49% Communication Services 3.69% Real Estate 2.11% Health Care 1.63% Technology 1.52% Consumer Cyclical 0.49% Asset Allocation
Asset Class Value Cash 6.4% Equity 93.6% Top Securities Holdings / Portfolio
Name Holding Value Quantity ICICI Bank Ltd (Financial Services)
Equity, Since 31 Oct 09 | ICICIBANK7% ₹188 Cr 1,300,000 Larsen & Toubro Ltd (Industrials)
Equity, Since 30 Jun 12 | LT5% ₹140 Cr 380,000 HDFC Bank Ltd (Financial Services)
Equity, Since 31 Aug 23 | HDFCBANK5% ₹136 Cr 700,000 J Kumar Infraprojects Ltd (Industrials)
Equity, Since 31 Oct 15 | JKIL4% ₹103 Cr 1,450,000 Kalpataru Projects International Ltd (Industrials)
Equity, Since 31 Jan 23 | KPIL3% ₹86 Cr 758,285 InterGlobe Aviation Ltd (Industrials)
Equity, Since 31 Dec 21 | INDIGO3% ₹80 Cr 150,000 NTPC Ltd (Utilities)
Equity, Since 31 Dec 17 | NTPC3% ₹73 Cr 2,200,000 Reliance Industries Ltd (Energy)
Equity, Since 31 May 24 | RELIANCE3% ₹71 Cr 500,000 Paradeep Phosphates Ltd (Basic Materials)
Equity, Since 31 May 22 | 5435303% ₹65 Cr 3,800,000
↓ -500,000 Bharti Airtel Ltd (Communication Services)
Equity, Since 30 Sep 20 | BHARTIARTL3% ₹65 Cr 350,000 3. L&T Emerging Businesses Fund
CAGR/Annualized return of 21% since its launch. Ranked 2 in Small Cap category. Return for 2024 was 28.5% , 2023 was 46.1% and 2022 was 1% . L&T Emerging Businesses Fund
Growth Launch Date 12 May 14 NAV (01 Jul 25) ₹83.7549 ↓ -0.22 (-0.26 %) Net Assets (Cr) ₹16,061 on 31 May 25 Category Equity - Small Cap AMC L&T Investment Management Ltd Rating ☆☆☆☆☆ Risk High Expense Ratio 1.73 Sharpe Ratio 0.02 Information Ratio -0.39 Alpha Ratio -3.97 Min Investment 5,000 Min SIP Investment 500 Exit Load 0-1 Years (1%),1 Years and above(NIL) Growth of 10,000 investment over the years.
Date Value 30 Jun 20 ₹10,000 30 Jun 21 ₹20,185 30 Jun 22 ₹22,103 30 Jun 23 ₹29,592 30 Jun 24 ₹45,892 30 Jun 25 ₹45,349 Returns for L&T Emerging Businesses Fund
absolute basis & more than 1 year are on CAGR (Compound Annual Growth Rate) basis. as on 1 Jul 25 Duration Returns 1 Month 4.8% 3 Month 16% 6 Month -6.3% 1 Year -2.5% 3 Year 26.9% 5 Year 35.2% 10 Year 15 Year Since launch 21% Historical performance (Yearly) on absolute basis
Year Returns 2024 28.5% 2023 46.1% 2022 1% 2021 77.4% 2020 15.5% 2019 -8.1% 2018 -13.7% 2017 66.5% 2016 10.2% 2015 12.3% Fund Manager information for L&T Emerging Businesses Fund
Name Since Tenure Venugopal Manghat 17 Dec 19 5.46 Yr. Sonal Gupta 1 Oct 23 1.67 Yr. Data below for L&T Emerging Businesses Fund as on 31 May 25
Equity Sector Allocation
Sector Value Industrials 28.92% Financial Services 16.18% Consumer Cyclical 15.6% Basic Materials 11.06% Technology 8.65% Health Care 7.18% Consumer Defensive 4.31% Real Estate 3.79% Energy 0.9% Asset Allocation
Asset Class Value Cash 3.42% Equity 96.58% Top Securities Holdings / Portfolio
Name Holding Value Quantity Aditya Birla Real Estate Ltd (Basic Materials)
Equity, Since 30 Sep 22 | ABREL2% ₹348 Cr 1,595,574 Techno Electric & Engineering Co Ltd (Industrials)
Equity, Since 31 Jan 19 | TECHNOE2% ₹340 Cr 2,414,100
↑ 129,138 K.P.R. Mill Ltd (Consumer Cyclical)
Equity, Since 28 Feb 15 | KPRMILL2% ₹335 Cr 2,972,250
↓ -545,950 Nippon Life India Asset Management Ltd Ordinary Shares (Financial Services)
Equity, Since 31 Aug 24 | NAM-INDIA2% ₹329 Cr 4,446,300 Multi Commodity Exchange of India Ltd (Financial Services)
Equity, Since 29 Feb 24 | MCX2% ₹316 Cr 479,200
↑ 24,050 The Federal Bank Ltd (Financial Services)
Equity, Since 30 Sep 22 | FEDERALBNK2% ₹314 Cr 15,544,000 Jyoti CNC Automation Ltd (Industrials)
Equity, Since 31 Jan 24 | JYOTICNC2% ₹300 Cr 2,317,401 PNB Housing Finance Ltd (Financial Services)
Equity, Since 31 Jul 24 | PNBHOUSING2% ₹268 Cr 2,566,200 Neuland Laboratories Ltd (Healthcare)
Equity, Since 31 Jan 24 | NEULANDLAB2% ₹266 Cr 231,110
↓ -30,267 Karur Vysya Bank Ltd (Financial Services)
Equity, Since 31 Oct 22 | KARURVYSYA2% ₹264 Cr 11,912,400 4. IDFC Infrastructure Fund
CAGR/Annualized return of 12.2% since its launch. Ranked 1 in Sectoral category. Return for 2024 was 39.3% , 2023 was 50.3% and 2022 was 1.7% . IDFC Infrastructure Fund
Growth Launch Date 8 Mar 11 NAV (01 Jul 25) ₹52.046 ↓ -0.12 (-0.22 %) Net Assets (Cr) ₹1,701 on 31 May 25 Category Equity - Sectoral AMC IDFC Asset Management Company Limited Rating ☆☆☆☆☆ Risk High Expense Ratio 2.33 Sharpe Ratio -0.09 Information Ratio 0 Alpha Ratio 0 Min Investment 5,000 Min SIP Investment 100 Exit Load 0-365 Days (1%),365 Days and above(NIL) Growth of 10,000 investment over the years.
Date Value 30 Jun 20 ₹10,000 30 Jun 21 ₹18,739 30 Jun 22 ₹17,927 30 Jun 23 ₹25,177 30 Jun 24 ₹46,897 30 Jun 25 ₹45,046 Returns for IDFC Infrastructure Fund
absolute basis & more than 1 year are on CAGR (Compound Annual Growth Rate) basis. as on 1 Jul 25 Duration Returns 1 Month 3.1% 3 Month 13.5% 6 Month -0.3% 1 Year -5.3% 3 Year 35.7% 5 Year 35% 10 Year 15 Year Since launch 12.2% Historical performance (Yearly) on absolute basis
Year Returns 2024 39.3% 2023 50.3% 2022 1.7% 2021 64.8% 2020 6.3% 2019 -5.3% 2018 -25.9% 2017 58.7% 2016 10.7% 2015 -0.2% Fund Manager information for IDFC Infrastructure Fund
Name Since Tenure Vishal Biraia 24 Jan 24 1.35 Yr. Ritika Behera 7 Oct 23 1.65 Yr. Gaurav Satra 7 Jun 24 0.98 Yr. Data below for IDFC Infrastructure Fund as on 31 May 25
Equity Sector Allocation
Sector Value Industrials 54.62% Utility 11.75% Basic Materials 8.33% Communication Services 4.62% Energy 3.78% Financial Services 2.9% Technology 2.63% Consumer Cyclical 2.13% Health Care 1.81% Real Estate 0.31% Asset Allocation
Asset Class Value Cash 6.61% Equity 93.39% Top Securities Holdings / Portfolio
Name Holding Value Quantity Kirloskar Brothers Ltd (Industrials)
Equity, Since 31 Dec 17 | KIRLOSBROS5% ₹80 Cr 443,385 GPT Infraprojects Ltd (Industrials)
Equity, Since 30 Nov 17 | GPTINFRA4% ₹68 Cr 4,797,143 Larsen & Toubro Ltd (Industrials)
Equity, Since 29 Feb 12 | LT4% ₹67 Cr 183,173 Reliance Industries Ltd (Energy)
Equity, Since 30 Jun 24 | RELIANCE4% ₹64 Cr 452,706 Bharti Airtel Ltd (Communication Services)
Equity, Since 30 Apr 19 | BHARTIARTL4% ₹61 Cr 330,018 UltraTech Cement Ltd (Basic Materials)
Equity, Since 31 Mar 14 | ULTRACEMCO3% ₹57 Cr 50,452 Bharat Electronics Ltd (Industrials)
Equity, Since 31 Oct 19 | BEL3% ₹55 Cr 1,431,700 Adani Ports & Special Economic Zone Ltd (Industrials)
Equity, Since 31 Dec 23 | ADANIPORTS3% ₹52 Cr 365,137 PTC India Financial Services Ltd (Financial Services)
Equity, Since 31 Dec 23 | PFS3% ₹46 Cr 12,400,122 Ahluwalia Contracts (India) Ltd (Industrials)
Equity, Since 30 Apr 15 | AHLUCONT3% ₹45 Cr 462,949
↓ -5,288 5. Franklin India Smaller Companies Fund
CAGR/Annualized return of 15.9% since its launch. Ranked 11 in Small Cap category. Return for 2024 was 23.2% , 2023 was 52.1% and 2022 was 3.6% . Franklin India Smaller Companies Fund
Growth Launch Date 13 Jan 06 NAV (01 Jul 25) ₹175.725 ↓ -0.01 (0.00 %) Net Assets (Cr) ₹13,545 on 31 May 25 Category Equity - Small Cap AMC Franklin Templeton Asst Mgmt(IND)Pvt Ltd Rating ☆☆☆☆ Risk Moderately High Expense Ratio 1.78 Sharpe Ratio -0.02 Information Ratio 0.23 Alpha Ratio -4.29 Min Investment 5,000 Min SIP Investment 500 Exit Load 0-1 Years (1%),1 Years and above(NIL) Growth of 10,000 investment over the years.
Date Value 30 Jun 20 ₹10,000 30 Jun 21 ₹19,651 30 Jun 22 ₹20,254 30 Jun 23 ₹28,568 30 Jun 24 ₹45,688 30 Jun 25 ₹44,619 Returns for Franklin India Smaller Companies Fund
absolute basis & more than 1 year are on CAGR (Compound Annual Growth Rate) basis. as on 1 Jul 25 Duration Returns 1 Month 3.1% 3 Month 16.2% 6 Month -2.8% 1 Year -3.7% 3 Year 30.2% 5 Year 34.7% 10 Year 15 Year Since launch 15.9% Historical performance (Yearly) on absolute basis
Year Returns 2024 23.2% 2023 52.1% 2022 3.6% 2021 56.4% 2020 18.7% 2019 -5% 2018 -17.4% 2017 43.5% 2016 10.2% 2015 9.6% Fund Manager information for Franklin India Smaller Companies Fund
Name Since Tenure R. Janakiraman 1 Feb 11 14.34 Yr. Sandeep Manam 18 Oct 21 3.62 Yr. Akhil Kalluri 8 Sep 22 2.73 Yr. Data below for Franklin India Smaller Companies Fund as on 31 May 25
Equity Sector Allocation
Sector Value Industrials 18.72% Financial Services 18.38% Consumer Cyclical 16.33% Health Care 11.28% Basic Materials 9.4% Technology 6.37% Real Estate 4.56% Consumer Defensive 4.01% Utility 2.74% Energy 0.8% Asset Allocation
Asset Class Value Cash 7.26% Equity 92.58% Top Securities Holdings / Portfolio
Name Holding Value Quantity Aster DM Healthcare Ltd Ordinary Shares (Healthcare)
Equity, Since 31 Jul 23 | ASTERDM3% ₹444 Cr 7,934,783
↓ -83,847 Brigade Enterprises Ltd (Real Estate)
Equity, Since 30 Jun 14 | BRIGADE3% ₹423 Cr 3,868,691 Karur Vysya Bank Ltd (Financial Services)
Equity, Since 31 Oct 12 | KARURVYSYA2% ₹310 Cr 13,998,917 Equitas Small Finance Bank Ltd Ordinary Shares (Financial Services)
Equity, Since 31 Oct 20 | EQUITASBNK2% ₹306 Cr 48,064,081 Eris Lifesciences Ltd Registered Shs (Healthcare)
Equity, Since 30 Sep 19 | ERIS2% ₹295 Cr 1,866,828 CCL Products (India) Ltd (Consumer Defensive)
Equity, Since 30 Apr 19 | CCL2% ₹288 Cr 3,260,279
↑ 200,000 Deepak Nitrite Ltd (Basic Materials)
Equity, Since 31 Jan 16 | DEEPAKNTR2% ₹281 Cr 1,387,967 Kalyan Jewellers India Ltd (Consumer Cyclical)
Equity, Since 31 May 22 | KALYANKJIL2% ₹278 Cr 4,963,469 Zensar Technologies Ltd (Technology)
Equity, Since 28 Feb 23 | ZENSARTECH2% ₹268 Cr 3,220,340 Crompton Greaves Consumer Electricals Ltd (Consumer Cyclical)
Equity, Since 31 Jan 24 | CROMPTON2% ₹244 Cr 6,900,000 6. DSP BlackRock India T.I.G.E.R Fund
CAGR/Annualized return of 17.9% since its launch. Ranked 12 in Sectoral category. Return for 2024 was 32.4% , 2023 was 49% and 2022 was 13.9% . DSP BlackRock India T.I.G.E.R Fund
Growth Launch Date 11 Jun 04 NAV (01 Jul 25) ₹320.139 ↑ 1.05 (0.33 %) Net Assets (Cr) ₹5,319 on 31 May 25 Category Equity - Sectoral AMC DSP BlackRock Invmt Managers Pvt. Ltd. Rating ☆☆☆☆ Risk High Expense Ratio 2.24 Sharpe Ratio -0.26 Information Ratio 0 Alpha Ratio 0 Min Investment 1,000 Min SIP Investment 500 Exit Load 0-12 Months (1%),12 Months and above(NIL) Growth of 10,000 investment over the years.
Date Value 30 Jun 20 ₹10,000 30 Jun 21 ₹17,690 30 Jun 22 ₹18,664 30 Jun 23 ₹25,666 30 Jun 24 ₹45,959 30 Jun 25 ₹44,312 Returns for DSP BlackRock India T.I.G.E.R Fund
absolute basis & more than 1 year are on CAGR (Compound Annual Growth Rate) basis. as on 1 Jul 25 Duration Returns 1 Month 3.7% 3 Month 13% 6 Month -1.3% 1 Year -4% 3 Year 33.8% 5 Year 34.5% 10 Year 15 Year Since launch 17.9% Historical performance (Yearly) on absolute basis
Year Returns 2024 32.4% 2023 49% 2022 13.9% 2021 51.6% 2020 2.7% 2019 6.7% 2018 -17.2% 2017 47% 2016 4.1% 2015 0.7% Fund Manager information for DSP BlackRock India T.I.G.E.R Fund
Name Since Tenure Rohit Singhania 21 Jun 10 14.96 Yr. Data below for DSP BlackRock India T.I.G.E.R Fund as on 31 May 25
Equity Sector Allocation
Sector Value Industrials 29.11% Basic Materials 14.96% Financial Services 9.96% Consumer Cyclical 8.85% Utility 8.65% Health Care 6.47% Energy 5.54% Communication Services 2.5% Technology 2.28% Real Estate 1.59% Consumer Defensive 1.52% Asset Allocation
Asset Class Value Cash 6.84% Equity 93.16% Top Securities Holdings / Portfolio
Name Holding Value Quantity Larsen & Toubro Ltd (Industrials)
Equity, Since 30 Jun 04 | LT5% ₹256 Cr 697,669
↑ 138,383 NTPC Ltd (Utilities)
Equity, Since 30 Nov 17 | NTPC4% ₹239 Cr 7,145,883 Apollo Hospitals Enterprise Ltd (Healthcare)
Equity, Since 31 Dec 24 | APOLLOHOSP3% ₹169 Cr 245,928 Power Grid Corp Of India Ltd (Utilities)
Equity, Since 31 Jan 25 | POWERGRID3% ₹161 Cr 5,567,574 Kirloskar Oil Engines Ltd (Industrials)
Equity, Since 31 Mar 23 | 5332933% ₹146 Cr 1,608,534 Amber Enterprises India Ltd Ordinary Shares (Consumer Cyclical)
Equity, Since 31 Dec 24 | AMBER3% ₹135 Cr 207,277 Coal India Ltd (Energy)
Equity, Since 31 Dec 23 | COALINDIA2% ₹132 Cr 3,321,453 Rainbow Childrens Medicare Ltd (Healthcare)
Equity, Since 31 Jan 25 | 5435242% ₹131 Cr 935,870 Bharti Airtel Ltd (Communication Services)
Equity, Since 31 Oct 18 | BHARTIARTL2% ₹128 Cr 688,435 Solar Industries India Ltd (Basic Materials)
Equity, Since 31 Mar 14 | SOLARINDS2% ₹121 Cr 75,291
↑ 8,793 7. Edelweiss Mid Cap Fund
CAGR/Annualized return of 14.3% since its launch. Ranked 22 in Mid Cap category. Return for 2024 was 38.9% , 2023 was 38.4% and 2022 was 2.4% . Edelweiss Mid Cap Fund
Growth Launch Date 26 Dec 07 NAV (01 Jul 25) ₹103.436 ↓ -0.28 (-0.27 %) Net Assets (Cr) ₹10,028 on 31 May 25 Category Equity - Mid Cap AMC Edelweiss Asset Management Limited Rating ☆☆☆ Risk High Expense Ratio 1.86 Sharpe Ratio 0.51 Information Ratio 0.17 Alpha Ratio 6.01 Min Investment 5,000 Min SIP Investment 500 Exit Load 0-12 Months (1%),12 Months and above(NIL) Growth of 10,000 investment over the years.
Date Value 30 Jun 20 ₹10,000 30 Jun 21 ₹18,751 30 Jun 22 ₹18,631 30 Jun 23 ₹24,320 30 Jun 24 ₹38,530 30 Jun 25 ₹43,069 Returns for Edelweiss Mid Cap Fund
absolute basis & more than 1 year are on CAGR (Compound Annual Growth Rate) basis. as on 1 Jul 25 Duration Returns 1 Month 5.7% 3 Month 16.9% 6 Month 2.4% 1 Year 10% 3 Year 31.9% 5 Year 33.8% 10 Year 15 Year Since launch 14.3% Historical performance (Yearly) on absolute basis
Year Returns 2024 38.9% 2023 38.4% 2022 2.4% 2021 50.3% 2020 26.4% 2019 5.2% 2018 -15.7% 2017 52.3% 2016 2.5% 2015 9.4% Fund Manager information for Edelweiss Mid Cap Fund
Name Since Tenure Dhruv Bhatia 14 Oct 24 0.63 Yr. Trideep Bhattacharya 1 Oct 21 3.67 Yr. Raj Koradia 1 Aug 24 0.83 Yr. Data below for Edelweiss Mid Cap Fund as on 31 May 25
Equity Sector Allocation
Sector Value Financial Services 22.23% Consumer Cyclical 15.48% Industrials 12.51% Basic Materials 10.79% Technology 10.75% Health Care 10.69% Consumer Defensive 5.63% Real Estate 3.24% Energy 2.43% Communication Services 2.3% Utility 0.75% Asset Allocation
Asset Class Value Cash 3.21% Equity 96.79% Top Securities Holdings / Portfolio
Name Holding Value Quantity Max Healthcare Institute Ltd Ordinary Shares (Healthcare)
Equity, Since 31 Jul 21 | MAXHEALTH3% ₹336 Cr 2,981,836
↑ 307,716 Coforge Ltd (Technology)
Equity, Since 30 Jun 23 | COFORGE3% ₹326 Cr 381,739
↑ 63,966 Persistent Systems Ltd (Technology)
Equity, Since 31 Mar 21 | PERSISTENT3% ₹323 Cr 573,588
↑ 91,154 Solar Industries India Ltd (Basic Materials)
Equity, Since 30 Sep 12 | SOLARINDS3% ₹319 Cr 197,880
↑ 2,470 Marico Ltd (Consumer Defensive)
Equity, Since 31 Oct 24 | MARICO3% ₹290 Cr 4,048,052
↑ 55,330 PB Fintech Ltd (Financial Services)
Equity, Since 29 Feb 24 | 5433902% ₹233 Cr 1,324,191
↑ 22,788 Page Industries Ltd (Consumer Cyclical)
Equity, Since 31 Oct 24 | PAGEIND2% ₹233 Cr 50,249
↑ 863 CG Power & Industrial Solutions Ltd (Industrials)
Equity, Since 31 May 24 | CGPOWER2% ₹221 Cr 3,218,245
↑ 57,869 Dixon Technologies (India) Ltd (Technology)
Equity, Since 31 Jan 20 | DIXON2% ₹216 Cr 146,827
↓ -50,566 UNO Minda Ltd (Consumer Cyclical)
Equity, Since 31 Aug 17 | UNOMINDA2% ₹214 Cr 2,120,902
↑ 39,719 8. Franklin Build India Fund
CAGR/Annualized return of 18.3% since its launch. Ranked 4 in Sectoral category. Return for 2024 was 27.8% , 2023 was 51.1% and 2022 was 11.2% . Franklin Build India Fund
Growth Launch Date 4 Sep 09 NAV (01 Jul 25) ₹143.513 ↑ 0.39 (0.27 %) Net Assets (Cr) ₹2,857 on 31 May 25 Category Equity - Sectoral AMC Franklin Templeton Asst Mgmt(IND)Pvt Ltd Rating ☆☆☆☆☆ Risk High Expense Ratio 2.13 Sharpe Ratio -0.14 Information Ratio 0 Alpha Ratio 0 Min Investment 5,000 Min SIP Investment 500 Exit Load 0-1 Years (1%),1 Years and above(NIL) Growth of 10,000 investment over the years.
Date Value 30 Jun 20 ₹10,000 30 Jun 21 ₹17,043 30 Jun 22 ₹17,797 30 Jun 23 ₹24,303 30 Jun 24 ₹43,144 30 Jun 25 ₹43,110 Returns for Franklin Build India Fund
absolute basis & more than 1 year are on CAGR (Compound Annual Growth Rate) basis. as on 1 Jul 25 Duration Returns 1 Month 3.8% 3 Month 11.9% 6 Month 3.1% 1 Year -0.2% 3 Year 34.7% 5 Year 33.7% 10 Year 15 Year Since launch 18.3% Historical performance (Yearly) on absolute basis
Year Returns 2024 27.8% 2023 51.1% 2022 11.2% 2021 45.9% 2020 5.4% 2019 6% 2018 -10.7% 2017 43.3% 2016 8.4% 2015 2.1% Fund Manager information for Franklin Build India Fund
Name Since Tenure Ajay Argal 18 Oct 21 3.62 Yr. Kiran Sebastian 7 Feb 22 3.31 Yr. Sandeep Manam 18 Oct 21 3.62 Yr. Data below for Franklin Build India Fund as on 31 May 25
Equity Sector Allocation
Sector Value Industrials 35.72% Energy 12.72% Utility 12.48% Financial Services 11.88% Communication Services 8% Basic Materials 7.23% Real Estate 3.12% Consumer Cyclical 2.68% Technology 1.89% Asset Allocation
Asset Class Value Cash 4.27% Equity 95.73% Top Securities Holdings / Portfolio
Name Holding Value Quantity Larsen & Toubro Ltd (Industrials)
Equity, Since 29 Feb 20 | LT9% ₹244 Cr 665,000 ICICI Bank Ltd (Financial Services)
Equity, Since 31 Mar 12 | ICICIBANK6% ₹173 Cr 1,200,000 Reliance Industries Ltd (Energy)
Equity, Since 31 Oct 21 | RELIANCE6% ₹171 Cr 1,200,000 InterGlobe Aviation Ltd (Industrials)
Equity, Since 29 Feb 20 | INDIGO6% ₹160 Cr 300,000 Oil & Natural Gas Corp Ltd (Energy)
Equity, Since 30 Jun 19 | ONGC5% ₹144 Cr 6,000,000
↑ 500,000 NTPC Ltd (Utilities)
Equity, Since 30 Nov 16 | NTPC5% ₹138 Cr 4,125,000 Bharti Airtel Ltd (Communication Services)
Equity, Since 30 Sep 09 | BHARTIARTL5% ₹132 Cr 710,000 Axis Bank Ltd (Financial Services)
Equity, Since 31 Mar 12 | AXISBANK4% ₹119 Cr 1,000,000 Power Grid Corp Of India Ltd (Utilities)
Equity, Since 28 Feb 21 | POWERGRID4% ₹104 Cr 3,600,000
↑ 235,000 Tata Power Co Ltd (Utilities)
Equity, Since 31 Jan 25 | TATAPOWER3% ₹79 Cr 2,000,000 9. LIC MF Infrastructure Fund
CAGR/Annualized return of 9.8% since its launch. Return for 2024 was 47.8% , 2023 was 44.4% and 2022 was 7.9% . LIC MF Infrastructure Fund
Growth Launch Date 29 Feb 08 NAV (01 Jul 25) ₹50.7897 ↑ 0.01 (0.02 %) Net Assets (Cr) ₹1,005 on 31 May 25 Category Equity - Sectoral AMC LIC Mutual Fund Asset Mgmt Co Ltd Rating Risk High Expense Ratio 2.3 Sharpe Ratio 0.2 Information Ratio 0.54 Alpha Ratio 6.66 Min Investment 5,000 Min SIP Investment 1,000 Exit Load 0-1 Years (1%),1 Years and above(NIL) Growth of 10,000 investment over the years.
Date Value 30 Jun 20 ₹10,000 30 Jun 21 ₹15,983 30 Jun 22 ₹17,801 30 Jun 23 ₹22,663 30 Jun 24 ₹41,985 30 Jun 25 ₹42,989 Returns for LIC MF Infrastructure Fund
absolute basis & more than 1 year are on CAGR (Compound Annual Growth Rate) basis. as on 1 Jul 25 Duration Returns 1 Month 3.3% 3 Month 17.2% 6 Month -1.8% 1 Year 0.5% 3 Year 34.2% 5 Year 33.5% 10 Year 15 Year Since launch 9.8% Historical performance (Yearly) on absolute basis
Year Returns 2024 47.8% 2023 44.4% 2022 7.9% 2021 46.6% 2020 -0.1% 2019 13.3% 2018 -14.6% 2017 42.2% 2016 -2.2% 2015 -6.2% Fund Manager information for LIC MF Infrastructure Fund
Name Since Tenure Yogesh Patil 18 Sep 20 4.7 Yr. Mahesh Bendre 1 Jul 24 0.92 Yr. Data below for LIC MF Infrastructure Fund as on 31 May 25
Equity Sector Allocation
Sector Value Industrials 51.57% Basic Materials 9.67% Consumer Cyclical 7.9% Utility 6.15% Financial Services 5.44% Real Estate 2.87% Communication Services 2.32% Technology 2.25% Health Care 0.42% Energy 0.4% Asset Allocation
Asset Class Value Cash 10.86% Equity 89.14% Top Securities Holdings / Portfolio
Name Holding Value Quantity Garware Hi-Tech Films Ltd (Basic Materials)
Equity, Since 31 Aug 23 | 5006554% ₹44 Cr 94,287 Shakti Pumps (India) Ltd (Industrials)
Equity, Since 31 Mar 24 | SHAKTIPUMP4% ₹39 Cr 452,572
↑ 44,445 Tata Power Co Ltd (Utilities)
Equity, Since 29 Feb 24 | TATAPOWER3% ₹28 Cr 724,927 Afcons Infrastructure Ltd (Industrials)
Equity, Since 31 Oct 24 | AFCONS3% ₹26 Cr 624,435
↑ 87,219 Bharat Heavy Electricals Ltd (Industrials)
Equity, Since 31 May 24 | BHEL2% ₹24 Cr 913,126
↓ -149,073 Schneider Electric Infrastructure Ltd (Industrials)
Equity, Since 31 Dec 23 | SCHNEIDER2% ₹23 Cr 305,924
↓ -26,125 REC Ltd (Financial Services)
Equity, Since 31 Jul 23 | RECLTD2% ₹23 Cr 571,332 Cummins India Ltd (Industrials)
Equity, Since 31 May 21 | CUMMINSIND2% ₹22 Cr 67,407
↑ 559 GE Vernova T&D India Ltd (Industrials)
Equity, Since 31 Jan 24 | 5222752% ₹22 Cr 96,061
↓ -30,853 TD Power Systems Ltd (Industrials)
Equity, Since 30 Apr 23 | TDPOWERSYS2% ₹21 Cr 397,031
↓ -79,438 10. Nippon India Power and Infra Fund
CAGR/Annualized return of 18.4% since its launch. Ranked 13 in Sectoral category. Return for 2024 was 26.9% , 2023 was 58% and 2022 was 10.9% . Nippon India Power and Infra Fund
Growth Launch Date 8 May 04 NAV (01 Jul 25) ₹353.655 ↑ 0.99 (0.28 %) Net Assets (Cr) ₹7,417 on 31 May 25 Category Equity - Sectoral AMC Nippon Life Asset Management Ltd. Rating ☆☆☆☆ Risk High Expense Ratio 2.05 Sharpe Ratio -0.18 Information Ratio 1.23 Alpha Ratio -3.24 Min Investment 5,000 Min SIP Investment 100 Exit Load 0-1 Years (1%),1 Years and above(NIL) Growth of 10,000 investment over the years.
Date Value 30 Jun 20 ₹10,000 30 Jun 21 ₹16,264 30 Jun 22 ₹16,626 30 Jun 23 ₹24,402 30 Jun 24 ₹44,515 30 Jun 25 ₹42,367 Returns for Nippon India Power and Infra Fund
absolute basis & more than 1 year are on CAGR (Compound Annual Growth Rate) basis. as on 1 Jul 25 Duration Returns 1 Month 3% 3 Month 12.2% 6 Month 1.3% 1 Year -5% 3 Year 37% 5 Year 33.5% 10 Year 15 Year Since launch 18.4% Historical performance (Yearly) on absolute basis
Year Returns 2024 26.9% 2023 58% 2022 10.9% 2021 48.9% 2020 10.8% 2019 -2.9% 2018 -21.1% 2017 61.7% 2016 0.1% 2015 0.3% Fund Manager information for Nippon India Power and Infra Fund
Name Since Tenure Kinjal Desai 25 May 18 7.02 Yr. Rahul Modi 19 Aug 24 0.78 Yr. Data below for Nippon India Power and Infra Fund as on 31 May 25
Equity Sector Allocation
Sector Value Industrials 39.58% Utility 20.84% Energy 9.44% Communication Services 7.36% Basic Materials 6.9% Consumer Cyclical 4.78% Real Estate 2.96% Financial Services 2.13% Technology 1.96% Health Care 1.95% Asset Allocation
Asset Class Value Cash 0.93% Equity 99.07% Top Securities Holdings / Portfolio
Name Holding Value Quantity Reliance Industries Ltd (Energy)
Equity, Since 30 Nov 18 | RELIANCE8% ₹597 Cr 4,200,000
↑ 100,000 NTPC Ltd (Utilities)
Equity, Since 31 May 09 | NTPC7% ₹531 Cr 15,900,000
↑ 400,000 Larsen & Toubro Ltd (Industrials)
Equity, Since 30 Nov 07 | LT7% ₹494 Cr 1,344,337 Bharti Airtel Ltd (Communication Services)
Equity, Since 30 Apr 18 | BHARTIARTL7% ₹483 Cr 2,600,000 Tata Power Co Ltd (Utilities)
Equity, Since 30 Apr 23 | TATAPOWER4% ₹310 Cr 7,900,789
↑ 200,000 Bharat Heavy Electricals Ltd (Industrials)
Equity, Since 30 Sep 24 | BHEL3% ₹226 Cr 8,713,730
↑ 200,000 CG Power & Industrial Solutions Ltd (Industrials)
Equity, Since 30 Sep 24 | CGPOWER3% ₹213 Cr 3,107,923
↑ 50,000 Kaynes Technology India Ltd (Industrials)
Equity, Since 30 Nov 22 | KAYNES3% ₹201 Cr 336,227
↓ -33,773 UltraTech Cement Ltd (Basic Materials)
Equity, Since 31 Oct 19 | ULTRACEMCO3% ₹196 Cr 175,000
↓ -25,000 Carborundum Universal Ltd (Industrials)
Equity, Since 30 Sep 23 | CARBORUNIV2% ₹179 Cr 1,800,000 11. ICICI Prudential Smallcap Fund
CAGR/Annualized return of 13.1% since its launch. Ranked 26 in Small Cap category. Return for 2024 was 15.6% , 2023 was 37.9% and 2022 was 5.7% . ICICI Prudential Smallcap Fund
Growth Launch Date 18 Oct 07 NAV (01 Jul 25) ₹88.7 ↑ 0.13 (0.15 %) Net Assets (Cr) ₹8,254 on 31 May 25 Category Equity - Small Cap AMC ICICI Prudential Asset Management Company Limited Rating ☆☆☆ Risk Moderately High Expense Ratio 2.04 Sharpe Ratio 0.05 Information Ratio -0.7 Alpha Ratio -2.45 Min Investment 5,000 Min SIP Investment 100 Exit Load 0-1 Years (1%),1 Years and above(NIL) Growth of 10,000 investment over the years.
Date Value 30 Jun 20 ₹10,000 30 Jun 21 ₹20,679 30 Jun 22 ₹22,840 30 Jun 23 ₹29,402 30 Jun 24 ₹41,557 30 Jun 25 ₹42,056 Returns for ICICI Prudential Smallcap Fund
absolute basis & more than 1 year are on CAGR (Compound Annual Growth Rate) basis. as on 1 Jul 25 Duration Returns 1 Month 3.7% 3 Month 15.2% 6 Month 2.5% 1 Year -0.2% 3 Year 22.4% 5 Year 33.2% 10 Year 15 Year Since launch 13.1% Historical performance (Yearly) on absolute basis
Year Returns 2024 15.6% 2023 37.9% 2022 5.7% 2021 61% 2020 22.8% 2019 10% 2018 -22.4% 2017 42.7% 2016 6% 2015 0.5% Fund Manager information for ICICI Prudential Smallcap Fund
Name Since Tenure Anish Tawakley 18 Sep 23 1.7 Yr. Sharmila D’mello 30 Jun 22 2.92 Yr. Aatur Shah 21 Apr 25 0.11 Yr. Data below for ICICI Prudential Smallcap Fund as on 31 May 25
Equity Sector Allocation
Sector Value Industrials 24.73% Basic Materials 24.26% Consumer Cyclical 13.54% Health Care 7.54% Financial Services 5.41% Consumer Defensive 2.99% Utility 2.81% Real Estate 1.89% Energy 1.48% Communication Services 1.47% Technology 1.23% Asset Allocation
Asset Class Value Cash 12.49% Equity 87.35% Other 0.15% Top Securities Holdings / Portfolio
Name Holding Value Quantity Larsen & Toubro Ltd (Industrials)
Equity, Since 31 Oct 23 | LT3% ₹274 Cr 745,573
↓ -15,000 UltraTech Cement Ltd (Basic Materials)
Equity, Since 30 Sep 23 | ULTRACEMCO3% ₹250 Cr 223,362 Atul Ltd (Basic Materials)
Equity, Since 31 Oct 23 | ATUL3% ₹213 Cr 299,022 Gujarat Pipavav Port Ltd (Industrials)
Equity, Since 31 Mar 18 | GPPL3% ₹213 Cr 13,629,398 Tata Chemicals Ltd (Basic Materials)
Equity, Since 31 Aug 24 | TATACHEM2% ₹203 Cr 2,285,261
↑ 20,000 Procter & Gamble Health Ltd (Healthcare)
Equity, Since 29 Feb 24 | PGHL2% ₹200 Cr 347,671 Cummins India Ltd (Industrials)
Equity, Since 30 Sep 23 | CUMMINSIND2% ₹195 Cr 597,962 TVS Holdings Ltd (Consumer Cyclical)
Equity, Since 30 Sep 23 | TVSHLTD2% ₹186 Cr 157,000
↓ -2,482 Gillette India Ltd (Consumer Defensive)
Equity, Since 31 Dec 23 | GILLETTE2% ₹174 Cr 184,649 Jamna Auto Industries Ltd (Consumer Cyclical)
Equity, Since 30 Sep 24 | JAMNAAUTO2% ₹170 Cr 18,437,522
↑ 1,282,781
The investors are suggested to invest in the SIP plans of their choice. The above-mentioned top 11 Mutual Funds are suitable for investors of all kind. So, either you are a high-risk investor or a relatively lower one, these SIP funds are the Best Mutual Funds to Invest. So, don’t wait, invest now!
Parameters to Consider While Investing in Best Systematic Investment Plans
To evaluate best performing SIP Funds, let’s know the factors that one must consider before investing.
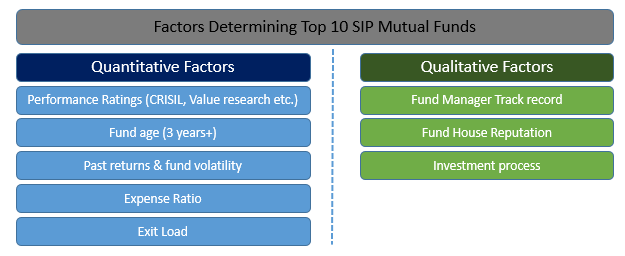
Quantitative Factors to Invest in Top SIP
The quantitative factors one must consider before investing via SIP include performance rating (as per CRISIL, Value Research etc.), fund age, past returns and fund volatility, expense ratio and exit load.
Qualitative Factors to Invest in Top SIP
Qualitative key statistics to analyse include the track record of the fund manager, reputation of the fund house and the investment process of the SIP fund.
How to Invest in SIP MF Online?
Open Free Investment Account for Lifetime at Fincash.com
Complete your Registration and KYC Process
Upload Documents (PAN, Aadhaar, etc.). And, You are Ready to Invest!
Begin your investment journey with SIP today!
FAQs
1. What are mutual funds?
A: Mutual funds are a part of the Systematic Investment Plan or SIPs that usually produce excellent returns later. When you invest in Mutual Funds, you diversify your investment portfolio. A mutual fund can be considered an investment tool developed by an Asset Management Company by pooling in multiple investors and companies' investments.
2. What are the different types of mutual funds?
A: Mutual funds can be broadly classified into the following types:
- Equity or growth funds
- Fixed income funds or Debt fund
- Tax saving funds
- Liquid Funds
- Balanced Fund
- Gilt Funds
- Exchange-Traded Funds or ETFs
3. What are growth equity funds?
A: The growth Equity Funds are the most common mutual funds. However, this portfolio will consist of volatile investments. Nevertheless, investors often prefer the growth equity funds as these have higher returns and can be invested for a shorter period.
4. Why should you invest in a debt fund?
A: These investments are ideal for individuals who are looking for fixed returns on investment. The fixed income can be earned from debentures, debt securities, commercial papers, and government securities. Mutual funds would create a portfolio of various types of investments and dissipate the risk.
5. Why should you invest in SIPs?
A: SIPs can provide the investor with assured income. If you are interested in earning passive income and want to ensure that your investment produces regular income, then you can consider investing in SIPs. .
6. Why invest in a tax saving mutual fund?
A: If you are looking to grow your Capital and at the same time want to enjoy tax exemptions, then you could invest in a tax saving mutual fund. Under Section 80C of the income tax Act of 1861, if you invest in equity-linked tax saving mutual funds, you can enjoy tax exemptions on your investment.
7. Do I need a broker to invest in mutual funds?
A: You will need the support of a broker or a financial institute to help you with the investment. You will need the support to identify the suitable SIPs and ensure that the investments have been made correctly.
 By Rohini Hiremath
Rohini Hiremath works as a Content Head at Fincash.com. Her passion is to deliver financial knowledge to the masses in simple language. She has a strong background in start-ups and diverse content. Rohini is also an SEO expert, coach and motivating team head!
You can connect with her at rohini.hiremath@fincash.com
All efforts have been made to ensure the information provided here is accurate. However, no guarantees are made regarding correctness of data. Please verify with scheme information document before making any investment.


AMFI Registration No. 112358 | CIN: U74999MH2016PTC282153
Shepard Technologies Pvt. Ltd. (with ARN code 112358) makes no warranties or representations, express or implied, on products offered through the platform. It accepts no liability for any damages or losses, however caused, in connection with the use of, or on the reliance of its product or related services. Terms and conditions of the website are applicable.
©2025 Shepard Technologies Private Limited. All Rights Reserved