How to Select Top & Best Mutual Fund?
How to select the best Mutual Fund? This is the question every investor has in mind while Investing their money. Everyone spends time doing a lot of research to get the top performing mutual fund or the best mutual fund to invest in! It is simply the most common yet most difficult question to answer in the Mutual fund market. Simply put, selecting a best Mutual Fund or to rephrase, a top performing Mutual Fund is like selecting a right partner for any venture. Any wrong decision – on either side – can lead to catastrophic consequences.
One of the most common mistakes in selecting the best mutual fund, that even the seasoned investors do sometimes, is to solely rely on the Mutual Fund Rankings or ratings. It is not that that Mutual Fund ratings are misleading, but there is a lot of further research required. Relying on rankings must not be the sole criteria. One also needs to periodically review the investment made every three months to ensure it is monitored well. Also, if rebalancing is required than one can do this once a year unless otherwise urgently needed.
Before looking into the process of selecting the best Mutual Fund, let’s build our basics. This is an important step that many investors tend to miss out on.
Why are you Making a Mutual Fund Investment?
The first step towards any good investment is to know and understand why are you investing and what are you investing in. You should have a clear objective behind your mutual fund investment. This makes your future decisions easier.
Before investing, you should have a clear idea of your risk appetite. To know what is your risk taking capacity, you must do a risk assessment or risk profiling. Risk assessment is important before investing as it gives you a clear picture of how much risk you can take. One can use various risk rating methodologies available on the internet or one can visit a financial advisor to do the same.
After undergoing risk profiling, one must turn their attention towards deciding the relevant Asset Allocation. You can decide the mix of assets like equity, debt and other asset classes depending on your risk taking capability. One should choose their asset allocation to match the level of risk they can take or lower than the risk they can take. This will ensure that there is no heartburn or sleepless nights later on. Your asset allocation can be either aggressive (more inclined towards investing in equity), moderate (balanced between equity & debt) or conservative (less investing in equity) depending on your risk profile.
Let’s take a look at a sample asset allocation-
| Aggressive | Moderate | Conservative | |
|---|---|---|---|
| ** Annual Return (p.a.)** | 15.7% | 13.4% | 10.8% |
| Equity | 50% | 35% | 20% |
| Debt | 30% | 40% | 40% |
| Gold | 10% | 10% | 10% |
| Cash | 10% | 15% | 30% |
| Total | 100% | 100% | 100% |
After completing your risk profiling and deciding the asset allocation, selecting the right product is the most important remaining task. Below are the factors that one needs to take into consideration on how to select best mutual fund.
Talk to our investment specialist
How to Select Best Mutual Funds?
As said earlier, selecting the best mutual fund only on the basis of their ratings may not be sufficient. There are other factors – quantitative and qualitative – that impact the process of selecting the best mutual fund. Let’s have a look at those factors.
Mutual Fund Ratings
Mutual Fund rankings help you in selecting some of the best Mutual Funds in the business at a given point in time. CRISIL, ICRA, MorningStar, etc. are some of the rating agencies. They evaluate a Mutual Fund scheme on various parameters and give out their results. These results help you narrow down your preferences and select the best Mutual Fund.
A thing to note here is that along with the rankings, it is wise to research on the Mutual Fund schemes’ past performances as well. This will only reduce your risk and enhance your returns. Best Performing Mutual Funds like Reliance Mutual Fund, SBI Mutual Fund, UTI Mutual Fund, and many others have been giving out decent to good results in the past.
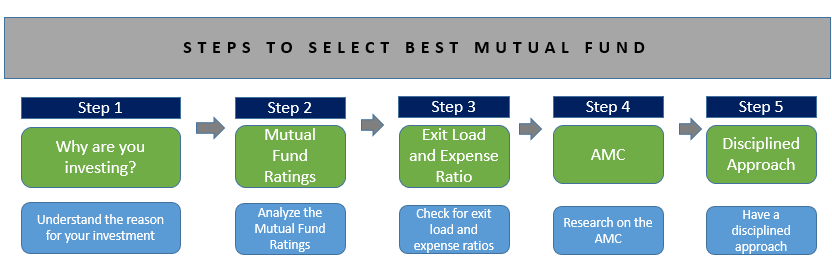
Expense Ratio
It is very important to check on entry/exit loads and expense ratios while looking for the best Mutual Fund to invest in. Many investors do not consider these recurring costs and suffer in the long run. You must check the expense ratio before investing. High expense ratios affect the schemes’ returns. Though the expense ratios are capped by SEBI, it is generally better to have low expense ratio scheme with high returns. However, always remember, the expense ratio is a relatively small portion, the returns generated or the extra returns generated by a good fund may totally supersede this. It would be penny wise and pound foolish to just select a fund on basis of expense ratio and later on miss out on returns by a good fund. Like with other factors, this needs to be viewed in conjunction with other factors such as ratings, returns etc and then will one be successful in selecting the best mutual fund.
Exit Load
Another thing to consider is the Exit Load. Different types of funds have variable exit loads depending on the nature of the investment. You might be charged with a higher percentage of exit load if you liquidate the scheme before the maturity period. This will obviously affect your Investment plan. This factor should be taken into consideration to match the investment tenor that one has. This will ensure that there are no exit loads incurring on the investment.
Fund Age
Investing in a fund which has atleast a three-year track record or more is a good idea. This minimum timeframe gives you some data points to actually evaluate the performance of the fund. A New Fund Offer(NFO), maybe recommended and good also, however, there is no track record to the performance of the Mutual Fund scheme. While getting into new products maybe a good idea at times, this should be limited to a small portion of the Portfolio. When investing a large portion of the portfolio, a track record is a must for those products or schemes. For Equity Funds, a three-year track record is a bare minimum, for liquid and ultra-short term funds even a one-year track may suffice (however, this needs to be supplemented with many other factors).
Past Returns and Volatility
Most investors want to invest in the top performing Mutual Fund schemes in the current market scenario. While it may look like a good investment at the time, it may or may not be the best mutual fund or top performing mutual fund in the future. Have a look at the data below from 2011 to 2015 giving the top 5 performing equity funds for each year:
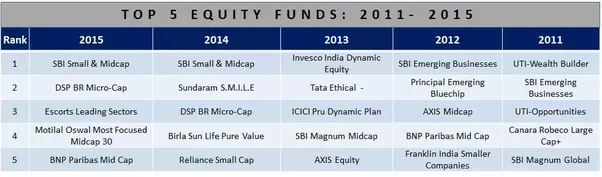
As you can see from the above table, apart from SBI Small & Midcap and BNP mid-cap, all the schemes are different for each year. This means the top performers of the year are not the top performers of the next year! This gives you an idea that what is best now may or may not be the best always in the future. So banking only on the returns while scouting for the best mutual funds is not always a wise move. So while investing, consider a fund that is consistent over a period and less volatile. Also, one should look at many other factors to select the best mutual fund to invest.
Now let’s look at some of the Qualitative Factors on how to select the best mutual fund.
How Invest in Mutual Funds Online?
Open Free Investment Account for Lifetime at Fincash.com.
Complete your Registration and KYC Process
Upload Documents (PAN, Aadhaar, etc.). And, You are Ready to Invest!
Reputation of the Asset Management Company
While one can look at many qualitative factors, one also needs to focus on the fund house offering the Mutual Fund scheme. A trusted asset management company with a good track record can help you invest smartly and wisely. A good AMC has a variety of investment schemes to provide you with good options for investing. One should look at the age of the fund house, the overall AUM, the track record of management, investment process of the fund house, the number of schemes on offer across categories and also, overall the number of top performing schemes across categories. So choosing a good AMC is also an important step towards choosing the best mutual fund.
| Quantitative Factors | Qualitative Factors |
|---|---|
| Performance Rating (Crisil, ValueResearch,etc) | Fund Manager Track Record |
| Fund Age (3+ years) | Fund House Reputation |
| Past Returns & Fund Volatility | Investment Process |
| Expense Ratio | |
| Exit Load |
Fund Manager Track Record
The fund manager is the professional who handles your money after you invest in a scheme. So, it important to know who is handling your money. You should know their past record and should check whether their investment style suits you. One needs to look at how many years they have been managing money, their track record over the last 5 years (or more) and the number of schemes they manage. Some basic filters here will lead to getting good performing schemes.
Investment Process
Rather than relying on solely the performance of the fund manager, one should ensure that there is an investment process in place. You don't want to get into a product with key-man risk. If there is an institutionalised investment process in place, this will ensure the scheme is managed well. Even there is a fund manager change. then your investment will be protected.
Monitor & Review: Have a Disciplined Approach
If you will consider all the above factors, you might get a best Mutual Fund or top mutual fund for yourself. But to get the best out of that best Mutual Fund, you need to have a disciplined approach and monitor the investment or scheme. Markets are volatile and your investment may see its value going up & down. You must trust the research and efforts taken in selecting the Mutual Fund and avoid falling prey to short-term losses (especially in equity). Simply put, if you feel you have erred in selecting the best mutual fund, you should take action and change the fund. However, a change should not be done before giving adequate time to perform to the earlier "best mutual fund". One should do re-balancing, not before one year. Always remember, even the best of investors (even Warren Buffet) make investment mistakes, however, we should get more right decisions than wrong ones in the long run. This will ensure that our portfolio or even the best mutual funds perform over time.
Fund Selection Methodology used to find 10 funds
Best Mutual Funds to Invest 2026 - 2027
Fund NAV Net Assets (Cr) 3 MO (%) 6 MO (%) 1 YR (%) 3 YR (%) 5 YR (%) 2024 (%) DSP World Gold Fund Growth ₹57.4446
↑ 0.60 ₹1,710 -18 15.9 95.1 49.9 23.5 167.1 Aditya Birla Sun Life Gold Fund Growth ₹44.6641
↓ -0.35 ₹1,732 -2.2 23.1 62.4 35.7 24.7 72 ICICI Prudential Regular Gold Savings Fund Growth ₹47.4453
↓ -0.44 ₹6,452 -2.4 22.9 62.1 35.7 24.7 72 SBI Gold Fund Growth ₹44.9365
↓ -0.41 ₹15,691 -2.4 23.1 61.5 35.6 24.6 71.5 HDFC Gold Fund Growth ₹45.8248
↓ -0.37 ₹11,464 -2.5 22.8 61.9 35.6 24.6 71.3 IDBI Gold Fund Growth ₹39.816
↓ -0.27 ₹779 -2.4 22.5 61.1 35.5 24.9 79 Nippon India Gold Savings Fund Growth ₹58.6601
↓ -0.53 ₹7,179 -2.3 22.7 62 35.5 24.5 71.2 Kotak Gold Fund Growth ₹58.9319
↓ -0.56 ₹6,693 -2.2 23.2 62.1 35.5 24.4 70.4 Axis Gold Fund Growth ₹44.5215
↓ -0.42 ₹2,942 -2.6 22.8 60.8 35.1 24.4 69.8 Invesco India Gold Fund Growth ₹42.9084
↓ -0.38 ₹479 -1.8 22.9 60.5 34.5 24.3 69.6 Note: Returns up to 1 year are on absolute basis & more than 1 year are on CAGR basis. as on 29 May 26 Research Highlights & Commentary of 10 Funds showcased
Commentary DSP World Gold Fund Aditya Birla Sun Life Gold Fund ICICI Prudential Regular Gold Savings Fund SBI Gold Fund HDFC Gold Fund IDBI Gold Fund Nippon India Gold Savings Fund Kotak Gold Fund Axis Gold Fund Invesco India Gold Fund Point 1 Bottom quartile AUM (₹1,710 Cr). Lower mid AUM (₹1,732 Cr). Upper mid AUM (₹6,452 Cr). Highest AUM (₹15,691 Cr). Top quartile AUM (₹11,464 Cr). Bottom quartile AUM (₹779 Cr). Upper mid AUM (₹7,179 Cr). Upper mid AUM (₹6,693 Cr). Lower mid AUM (₹2,942 Cr). Bottom quartile AUM (₹479 Cr). Point 2 Oldest track record among peers (18 yrs). Established history (14+ yrs). Established history (14+ yrs). Established history (14+ yrs). Established history (14+ yrs). Established history (13+ yrs). Established history (15+ yrs). Established history (15+ yrs). Established history (14+ yrs). Established history (14+ yrs). Point 3 Top rated. Rating: 3★ (top quartile). Rating: 1★ (lower mid). Rating: 2★ (upper mid). Rating: 1★ (lower mid). Not Rated. Rating: 2★ (upper mid). Rating: 1★ (bottom quartile). Rating: 1★ (bottom quartile). Rating: 3★ (upper mid). Point 4 Risk profile: High. Risk profile: Moderately High. Risk profile: Moderately High. Risk profile: Moderately High. Risk profile: Moderately High. Risk profile: Moderately High. Risk profile: Moderately High. Risk profile: Moderately High. Risk profile: Moderately High. Risk profile: Moderately High. Point 5 5Y return: 23.47% (bottom quartile). 5Y return: 24.68% (top quartile). 5Y return: 24.65% (upper mid). 5Y return: 24.58% (upper mid). 5Y return: 24.56% (upper mid). 5Y return: 24.87% (top quartile). 5Y return: 24.49% (lower mid). 5Y return: 24.38% (bottom quartile). 5Y return: 24.42% (lower mid). 5Y return: 24.28% (bottom quartile). Point 6 3Y return: 49.87% (top quartile). 3Y return: 35.72% (top quartile). 3Y return: 35.67% (upper mid). 3Y return: 35.64% (upper mid). 3Y return: 35.62% (upper mid). 3Y return: 35.50% (lower mid). 3Y return: 35.47% (lower mid). 3Y return: 35.46% (bottom quartile). 3Y return: 35.08% (bottom quartile). 3Y return: 34.47% (bottom quartile). Point 7 1Y return: 95.14% (top quartile). 1Y return: 62.41% (top quartile). 1Y return: 62.09% (upper mid). 1Y return: 61.52% (lower mid). 1Y return: 61.91% (lower mid). 1Y return: 61.14% (bottom quartile). 1Y return: 62.00% (upper mid). 1Y return: 62.12% (upper mid). 1Y return: 60.80% (bottom quartile). 1Y return: 60.45% (bottom quartile). Point 8 Alpha: 2.73 (top quartile). 1M return: 5.80% (top quartile). 1M return: 5.70% (upper mid). 1M return: 4.09% (bottom quartile). 1M return: 5.78% (upper mid). 1M return: 5.50% (lower mid). 1M return: 5.79% (upper mid). 1M return: 5.82% (top quartile). 1M return: 3.84% (bottom quartile). 1M return: 5.68% (lower mid). Point 9 Sharpe: 1.93 (top quartile). Alpha: 0.00 (top quartile). Alpha: 0.00 (upper mid). Alpha: 0.00 (upper mid). Alpha: 0.00 (upper mid). Alpha: 0.00 (lower mid). Alpha: 0.00 (lower mid). Alpha: 0.00 (bottom quartile). Alpha: 0.00 (bottom quartile). Alpha: 0.00 (bottom quartile). Point 10 Information ratio: -0.57 (bottom quartile). Sharpe: 1.58 (bottom quartile). Sharpe: 1.65 (lower mid). Sharpe: 1.76 (upper mid). Sharpe: 1.74 (upper mid). Sharpe: 1.60 (bottom quartile). Sharpe: 1.58 (bottom quartile). Sharpe: 1.94 (top quartile). Sharpe: 1.89 (upper mid). Sharpe: 1.74 (lower mid). DSP World Gold Fund
Aditya Birla Sun Life Gold Fund
ICICI Prudential Regular Gold Savings Fund
SBI Gold Fund
HDFC Gold Fund
IDBI Gold Fund
Nippon India Gold Savings Fund
Kotak Gold Fund
Axis Gold Fund
Invesco India Gold Fund
*Below is the detailed list of top mutual funds based on past 3 year CAGR returns.
"The primary investment objective of the Scheme is to seek capital appreciation by investing predominantly in units of MLIIF - WGF. The Scheme may, at the discretion of the Investment Manager, also invest in the units of other similar overseas mutual fund schemes, which may constitute a significant part of its corpus. The Scheme may also invest a certain portion of its corpus in money market securities and/or units of money market/liquid schemes of DSP Merrill Lynch Mutual Fund, in order to meet liquidity requirements from time to time. However, there is no assurance that the investment objective of the Scheme will be realized." Research Highlights for DSP World Gold Fund Below is the key information for DSP World Gold Fund Returns up to 1 year are on An Open ended Fund of Funds Scheme with the investment objective to provide returns that tracks returns provided by Birla Sun Life Gold ETF (BSL Gold ETF). Research Highlights for Aditya Birla Sun Life Gold Fund Below is the key information for Aditya Birla Sun Life Gold Fund Returns up to 1 year are on ICICI Prudential Regular Gold Savings Fund (the Scheme) is a fund of funds scheme with the primary objective to generate returns by investing in units of ICICI Prudential Gold Exchange Traded Fund (IPru Gold ETF).
However, there can be no assurance that the investment objectives of the Scheme will be realized. Research Highlights for ICICI Prudential Regular Gold Savings Fund Below is the key information for ICICI Prudential Regular Gold Savings Fund Returns up to 1 year are on The scheme seeks to provide returns that closely correspond to returns provided by SBI - ETF Gold (Previously known as SBI GETS). Research Highlights for SBI Gold Fund Below is the key information for SBI Gold Fund Returns up to 1 year are on To seek capital appreciation by investing in units of HDFC Gold Exchange Traded Fund (HGETF). Research Highlights for HDFC Gold Fund Below is the key information for HDFC Gold Fund Returns up to 1 year are on The investment objective of the Scheme will be to generate returns that correspond closely to the returns generated by IDBI Gold Exchange Traded Fund (IDBI GOLD ETF). Research Highlights for IDBI Gold Fund Below is the key information for IDBI Gold Fund Returns up to 1 year are on The investment objective of the Scheme is to seek to provide returns that closely correspond to returns provided by Reliance ETF Gold BeES. Research Highlights for Nippon India Gold Savings Fund Below is the key information for Nippon India Gold Savings Fund Returns up to 1 year are on The investment objective of the scheme is to generate returns by investing in units of Kotak Gold Exchange Traded Fund. Research Highlights for Kotak Gold Fund Below is the key information for Kotak Gold Fund Returns up to 1 year are on To generate returns that closely correspond to returns generated by Axis Gold ETF. Research Highlights for Axis Gold Fund Below is the key information for Axis Gold Fund Returns up to 1 year are on To provide returns that closely corresponds to returns provided by Invesco India Gold Exchange Traded Fund. Research Highlights for Invesco India Gold Fund Below is the key information for Invesco India Gold Fund Returns up to 1 year are on 1. DSP World Gold Fund
DSP World Gold Fund
Growth Launch Date 14 Sep 07 NAV (29 May 26) ₹57.4446 ↑ 0.60 (1.06 %) Net Assets (Cr) ₹1,710 on 30 Apr 26 Category Equity - Global AMC DSP BlackRock Invmt Managers Pvt. Ltd. Rating ☆☆☆ Risk High Expense Ratio 1.41 Sharpe Ratio 1.93 Information Ratio -0.57 Alpha Ratio 2.73 Min Investment 1,000 Min SIP Investment 500 Exit Load 0-12 Months (1%),12 Months and above(NIL) Growth of 10,000 investment over the years.
Date Value 31 May 21 ₹10,000 31 May 22 ₹8,263 31 May 23 ₹8,534 31 May 24 ₹9,763 31 May 25 ₹14,583 31 May 26 ₹28,558 Returns for DSP World Gold Fund
absolute basis & more than 1 year are on CAGR (Compound Annual Growth Rate) basis. as on 29 May 26 Duration Returns 1 Month 1.1% 3 Month -18% 6 Month 15.9% 1 Year 95.1% 3 Year 49.9% 5 Year 23.5% 10 Year 15 Year Since launch 9.8% Historical performance (Yearly) on absolute basis
Year Returns 2024 167.1% 2023 15.9% 2022 7% 2021 -7.7% 2020 -9% 2019 31.4% 2018 35.1% 2017 -10.7% 2016 -4% 2015 52.7% Fund Manager information for DSP World Gold Fund
Name Since Tenure Kaivalya Nadkarni 1 May 25 1 Yr. Data below for DSP World Gold Fund as on 30 Apr 26
Equity Sector Allocation
Sector Value Basic Materials 93.74% Asset Allocation
Asset Class Value Cash 4.22% Equity 93.74% Debt 0.01% Other 2.03% Top Securities Holdings / Portfolio
Name Holding Value Quantity BGF World Gold I2
Investment Fund | -69% ₹1,216 Cr 1,063,805
↓ -39,784 VanEck Gold Miners ETF
- | GDX28% ₹498 Cr 573,719 Treps / Reverse Repo Investments
CBLO/Reverse Repo | -3% ₹59 Cr Net Receivables/Payables
Net Current Assets | -0% -₹3 Cr 2. Aditya Birla Sun Life Gold Fund
Aditya Birla Sun Life Gold Fund
Growth Launch Date 20 Mar 12 NAV (01 Jun 26) ₹44.6641 ↓ -0.35 (-0.77 %) Net Assets (Cr) ₹1,732 on 30 Apr 26 Category Gold - Gold AMC Birla Sun Life Asset Management Co Ltd Rating ☆☆☆ Risk Moderately High Expense Ratio 0.51 Sharpe Ratio 1.58 Information Ratio 0 Alpha Ratio 0 Min Investment 100 Min SIP Investment 100 Exit Load 0-365 Days (1%),365 Days and above(NIL) Growth of 10,000 investment over the years.
Date Value 31 May 21 ₹10,000 31 May 22 ₹10,272 31 May 23 ₹11,929 31 May 24 ₹14,191 31 May 25 ₹18,394 31 May 26 ₹29,767 Returns for Aditya Birla Sun Life Gold Fund
absolute basis & more than 1 year are on CAGR (Compound Annual Growth Rate) basis. as on 29 May 26 Duration Returns 1 Month 5.8% 3 Month -2.2% 6 Month 23.1% 1 Year 62.4% 3 Year 35.7% 5 Year 24.7% 10 Year 15 Year Since launch 11.2% Historical performance (Yearly) on absolute basis
Year Returns 2024 72% 2023 18.7% 2022 14.5% 2021 12.3% 2020 -5% 2019 26% 2018 21.3% 2017 6.8% 2016 1.6% 2015 11.5% Fund Manager information for Aditya Birla Sun Life Gold Fund
Name Since Tenure Priya Sridhar 31 Dec 24 1.33 Yr. Data below for Aditya Birla Sun Life Gold Fund as on 30 Apr 26
Asset Allocation
Asset Class Value Cash 1.6% Other 98.4% Top Securities Holdings / Portfolio
Name Holding Value Quantity Aditya BSL Gold ETF
- | -100% ₹1,731 Cr 132,137,210
↑ 1,914,367 Clearing Corporation Of India Limited
CBLO/Reverse Repo | -0% ₹4 Cr Net Receivables / (Payables)
Net Current Assets | -0% -₹3 Cr 3. ICICI Prudential Regular Gold Savings Fund
ICICI Prudential Regular Gold Savings Fund
Growth Launch Date 11 Oct 11 NAV (01 Jun 26) ₹47.4453 ↓ -0.44 (-0.92 %) Net Assets (Cr) ₹6,452 on 30 Apr 26 Category Gold - Gold AMC ICICI Prudential Asset Management Company Limited Rating ☆ Risk Moderately High Expense Ratio 0.38 Sharpe Ratio 1.65 Information Ratio 0 Alpha Ratio 0 Min Investment 5,000 Min SIP Investment 100 Exit Load 0-15 Months (2%),15 Months and above(NIL) Growth of 10,000 investment over the years.
Date Value 31 May 21 ₹10,000 31 May 22 ₹10,330 31 May 23 ₹11,978 31 May 24 ₹14,288 31 May 25 ₹18,538 31 May 26 ₹29,834 Returns for ICICI Prudential Regular Gold Savings Fund
absolute basis & more than 1 year are on CAGR (Compound Annual Growth Rate) basis. as on 29 May 26 Duration Returns 1 Month 5.7% 3 Month -2.4% 6 Month 22.9% 1 Year 62.1% 3 Year 35.7% 5 Year 24.7% 10 Year 15 Year Since launch 11.3% Historical performance (Yearly) on absolute basis
Year Returns 2024 72% 2023 19.5% 2022 13.5% 2021 12.7% 2020 -5.4% 2019 26.6% 2018 22.7% 2017 7.4% 2016 0.8% 2015 8.9% Fund Manager information for ICICI Prudential Regular Gold Savings Fund
Name Since Tenure Manish Banthia 27 Sep 12 13.6 Yr. Nishit Patel 29 Dec 20 5.34 Yr. Ashwini Bharucha 1 Nov 25 0.5 Yr. Venus Ahuja 1 Nov 25 0.5 Yr. Data below for ICICI Prudential Regular Gold Savings Fund as on 30 Apr 26
Asset Allocation
Asset Class Value Cash 1.64% Other 98.36% Top Securities Holdings / Portfolio
Name Holding Value Quantity ICICI Pru Gold ETF
- | -100% ₹6,162 Cr 491,634,458
↑ 13,035,487 Treps
CBLO/Reverse Repo | -1% ₹37 Cr Net Current Assets
Net Current Assets | -1% -₹34 Cr 4. SBI Gold Fund
SBI Gold Fund
Growth Launch Date 12 Sep 11 NAV (01 Jun 26) ₹44.9365 ↓ -0.41 (-0.91 %) Net Assets (Cr) ₹15,691 on 30 Apr 26 Category Gold - Gold AMC SBI Funds Management Private Limited Rating ☆☆ Risk Moderately High Expense Ratio 0.3 Sharpe Ratio 1.76 Information Ratio 0 Alpha Ratio 0 Min Investment 5,000 Min SIP Investment 500 Exit Load 0-1 Years (1%),1 Years and above(NIL) Growth of 10,000 investment over the years.
Date Value 31 May 21 ₹10,000 31 May 22 ₹10,301 31 May 23 ₹12,026 31 May 24 ₹14,335 31 May 25 ₹18,578 31 May 26 ₹30,007 Returns for SBI Gold Fund
absolute basis & more than 1 year are on CAGR (Compound Annual Growth Rate) basis. as on 29 May 26 Duration Returns 1 Month 4.1% 3 Month -2.4% 6 Month 23.1% 1 Year 61.5% 3 Year 35.6% 5 Year 24.6% 10 Year 15 Year Since launch 10.8% Historical performance (Yearly) on absolute basis
Year Returns 2024 71.5% 2023 19.6% 2022 14.1% 2021 12.6% 2020 -5.7% 2019 27.4% 2018 22.8% 2017 6.4% 2016 3.5% 2015 10% Fund Manager information for SBI Gold Fund
Name Since Tenure Viral Chhadva 1 Mar 26 0.17 Yr. Data below for SBI Gold Fund as on 30 Apr 26
Asset Allocation
Asset Class Value Cash 1.59% Other 98.41% Top Securities Holdings / Portfolio
Name Holding Value Quantity SBI Gold ETF
- | -100% ₹15,710 Cr 1,232,736,194
↑ 33,250,000 Net Receivable / Payable
Net Current Assets | -0% -₹52 Cr Treps
CBLO/Reverse Repo | -0% ₹33 Cr 5. HDFC Gold Fund
HDFC Gold Fund
Growth Launch Date 24 Oct 11 NAV (01 Jun 26) ₹45.8248 ↓ -0.37 (-0.79 %) Net Assets (Cr) ₹11,464 on 30 Apr 26 Category Gold - Gold AMC HDFC Asset Management Company Limited Rating ☆ Risk Moderately High Expense Ratio 0.49 Sharpe Ratio 1.74 Information Ratio 0 Alpha Ratio 0 Min Investment 5,000 Min SIP Investment 300 Exit Load 0-6 Months (2%),6-12 Months (1%),12 Months and above(NIL) Growth of 10,000 investment over the years.
Date Value 31 May 21 ₹10,000 31 May 22 ₹10,301 31 May 23 ₹11,946 31 May 24 ₹14,276 31 May 25 ₹18,480 31 May 26 ₹29,715 Returns for HDFC Gold Fund
absolute basis & more than 1 year are on CAGR (Compound Annual Growth Rate) basis. as on 29 May 26 Duration Returns 1 Month 5.8% 3 Month -2.5% 6 Month 22.8% 1 Year 61.9% 3 Year 35.6% 5 Year 24.6% 10 Year 15 Year Since launch 11.1% Historical performance (Yearly) on absolute basis
Year Returns 2024 71.3% 2023 18.9% 2022 14.1% 2021 12.7% 2020 -5.5% 2019 27.5% 2018 21.7% 2017 6.6% 2016 2.8% 2015 10.1% Fund Manager information for HDFC Gold Fund
Name Since Tenure Arun Agarwal 15 Feb 23 3.21 Yr. Nandita Menezes 29 Mar 25 1.09 Yr. Data below for HDFC Gold Fund as on 30 Apr 26
Asset Allocation
Asset Class Value Cash 1.28% Other 98.72% Top Securities Holdings / Portfolio
Name Holding Value Quantity HDFC Gold ETF
- | -100% ₹10,998 Cr 881,460,937
↑ 16,931,000 Net Current Assets
Net Current Assets | -0% -₹28 Cr Treps - Tri-Party Repo
CBLO/Reverse Repo | -0% ₹21 Cr 6. IDBI Gold Fund
IDBI Gold Fund
Growth Launch Date 14 Aug 12 NAV (01 Jun 26) ₹39.816 ↓ -0.27 (-0.68 %) Net Assets (Cr) ₹779 on 30 Apr 26 Category Gold - Gold AMC IDBI Asset Management Limited Rating Risk Moderately High Expense Ratio 0.64 Sharpe Ratio 1.6 Information Ratio 0 Alpha Ratio 0 Min Investment 5,000 Min SIP Investment 500 Exit Load 0-12 Months (1%),12 Months and above(NIL) Growth of 10,000 investment over the years.
Date Value 31 May 21 ₹10,000 31 May 22 ₹10,328 31 May 23 ₹12,228 31 May 24 ₹14,525 31 May 25 ₹18,792 31 May 26 ₹30,189 Returns for IDBI Gold Fund
absolute basis & more than 1 year are on CAGR (Compound Annual Growth Rate) basis. as on 29 May 26 Duration Returns 1 Month 5.5% 3 Month -2.4% 6 Month 22.5% 1 Year 61.1% 3 Year 35.5% 5 Year 24.9% 10 Year 15 Year Since launch 10.6% Historical performance (Yearly) on absolute basis
Year Returns 2024 79% 2023 18.7% 2022 14.8% 2021 12% 2020 -4% 2019 24.2% 2018 21.6% 2017 5.8% 2016 1.4% 2015 8.3% Fund Manager information for IDBI Gold Fund
Name Since Tenure Sumit Bhatnagar 1 Jun 24 1.91 Yr. Data below for IDBI Gold Fund as on 30 Apr 26
Asset Allocation
Asset Class Value Cash 1.88% Other 98.12% Top Securities Holdings / Portfolio
Name Holding Value Quantity LIC MF Gold ETF
- | -100% ₹779 Cr 58,069,200
↑ 1,415,000 Treps
CBLO/Reverse Repo | -1% ₹4 Cr Net Receivables / (Payables)
Net Current Assets | -0% -₹4 Cr 7. Nippon India Gold Savings Fund
Nippon India Gold Savings Fund
Growth Launch Date 7 Mar 11 NAV (01 Jun 26) ₹58.6601 ↓ -0.53 (-0.90 %) Net Assets (Cr) ₹7,179 on 30 Apr 26 Category Gold - Gold AMC Nippon Life Asset Management Ltd. Rating ☆☆ Risk Moderately High Expense Ratio 0.35 Sharpe Ratio 1.58 Information Ratio 0 Alpha Ratio 0 Min Investment 5,000 Min SIP Investment 100 Exit Load 0-1 Years (2%),1 Years and above(NIL) Growth of 10,000 investment over the years.
Date Value 31 May 21 ₹10,000 31 May 22 ₹10,275 31 May 23 ₹11,912 31 May 24 ₹14,231 31 May 25 ₹18,391 31 May 26 ₹29,647 Returns for Nippon India Gold Savings Fund
absolute basis & more than 1 year are on CAGR (Compound Annual Growth Rate) basis. as on 29 May 26 Duration Returns 1 Month 5.8% 3 Month -2.3% 6 Month 22.7% 1 Year 62% 3 Year 35.5% 5 Year 24.5% 10 Year 15 Year Since launch 12.4% Historical performance (Yearly) on absolute basis
Year Returns 2024 71.2% 2023 19% 2022 14.3% 2021 12.3% 2020 -5.5% 2019 26.6% 2018 22.5% 2017 6% 2016 1.7% 2015 11.6% Fund Manager information for Nippon India Gold Savings Fund
Name Since Tenure Himanshu Mange 23 Dec 23 2.36 Yr. Data below for Nippon India Gold Savings Fund as on 30 Apr 26
Asset Allocation
Asset Class Value Cash 1.62% Other 98.38% Top Securities Holdings / Portfolio
Name Holding Value Quantity Nippon India ETF Gold BeES
- | -100% ₹7,181 Cr 581,787,572
↑ 12,095,589 Net Current Assets
Net Current Assets | -0% -₹15 Cr Triparty Repo
CBLO/Reverse Repo | -0% ₹12 Cr Cash Margin - Ccil
CBLO/Reverse Repo | -0% ₹0 Cr Cash
Net Current Assets | -0% ₹0 Cr 00 8. Kotak Gold Fund
Kotak Gold Fund
Growth Launch Date 25 Mar 11 NAV (01 Jun 26) ₹58.9319 ↓ -0.56 (-0.94 %) Net Assets (Cr) ₹6,693 on 30 Apr 26 Category Gold - Gold AMC Kotak Mahindra Asset Management Co Ltd Rating ☆ Risk Moderately High Expense Ratio 0.5 Sharpe Ratio 1.94 Information Ratio 0 Alpha Ratio 0 Min Investment 5,000 Min SIP Investment 1,000 Exit Load 0-6 Months (2%),6-12 Months (1%),12 Months and above(NIL) Growth of 10,000 investment over the years.
Date Value 31 May 21 ₹10,000 31 May 22 ₹10,319 31 May 23 ₹11,876 31 May 24 ₹14,143 31 May 25 ₹18,316 31 May 26 ₹29,482 Returns for Kotak Gold Fund
absolute basis & more than 1 year are on CAGR (Compound Annual Growth Rate) basis. as on 29 May 26 Duration Returns 1 Month 5.8% 3 Month -2.2% 6 Month 23.2% 1 Year 62.1% 3 Year 35.5% 5 Year 24.4% 10 Year 15 Year Since launch 12.5% Historical performance (Yearly) on absolute basis
Year Returns 2024 70.4% 2023 18.9% 2022 13.9% 2021 11.7% 2020 -4.7% 2019 26.6% 2018 24.1% 2017 7.3% 2016 2.5% 2015 10.2% Fund Manager information for Kotak Gold Fund
Name Since Tenure Abhishek Bisen 25 Mar 11 15.11 Yr. Jeetu Sonar 1 Oct 22 3.58 Yr. Data below for Kotak Gold Fund as on 30 Apr 26
Asset Allocation
Asset Class Value Cash 1.52% Other 98.48% Top Securities Holdings / Portfolio
Name Holding Value Quantity Kotak Gold ETF
- | -100% ₹6,427 Cr 526,446,226
↑ 10,546,203 Triparty Repo
CBLO/Reverse Repo | -1% ₹36 Cr Net Current Assets/(Liabilities)
Net Current Assets | -0% -₹24 Cr 9. Axis Gold Fund
Axis Gold Fund
Growth Launch Date 20 Oct 11 NAV (01 Jun 26) ₹44.5215 ↓ -0.42 (-0.94 %) Net Assets (Cr) ₹2,942 on 30 Apr 26 Category Gold - Gold AMC Axis Asset Management Company Limited Rating ☆ Risk Moderately High Expense Ratio 0.5 Sharpe Ratio 1.89 Information Ratio 0 Alpha Ratio 0 Min Investment 5,000 Min SIP Investment 1,000 Exit Load 0-1 Years (1%),1 Years and above(NIL) Growth of 10,000 investment over the years.
Date Value 31 May 21 ₹10,000 31 May 22 ₹10,356 31 May 23 ₹12,099 31 May 24 ₹14,375 31 May 25 ₹18,543 31 May 26 ₹29,818 Returns for Axis Gold Fund
absolute basis & more than 1 year are on CAGR (Compound Annual Growth Rate) basis. as on 29 May 26 Duration Returns 1 Month 3.8% 3 Month -2.6% 6 Month 22.8% 1 Year 60.8% 3 Year 35.1% 5 Year 24.4% 10 Year 15 Year Since launch 10.8% Historical performance (Yearly) on absolute basis
Year Returns 2024 69.8% 2023 19.2% 2022 14.7% 2021 12.5% 2020 -4.7% 2019 26.9% 2018 23.1% 2017 8.3% 2016 0.7% 2015 10.7% Fund Manager information for Axis Gold Fund
Name Since Tenure Aditya Pagaria 9 Nov 21 4.48 Yr. Pratik Tibrewal 1 Feb 25 1.24 Yr. Data below for Axis Gold Fund as on 30 Apr 26
Asset Allocation
Asset Class Value Cash 1.22% Other 98.78% Top Securities Holdings / Portfolio
Name Holding Value Quantity Axis Gold ETF
- | -100% ₹2,819 Cr 231,790,486
↑ 6,588,565 Net Receivables / (Payables)
CBLO | -1% -₹16 Cr Clearing Corporation Of India Ltd
CBLO/Reverse Repo | -0% ₹6 Cr 10. Invesco India Gold Fund
Invesco India Gold Fund
Growth Launch Date 5 Dec 11 NAV (01 Jun 26) ₹42.9084 ↓ -0.38 (-0.87 %) Net Assets (Cr) ₹479 on 30 Apr 26 Category Gold - Gold AMC Invesco Asset Management (India) Private Ltd Rating ☆☆☆ Risk Moderately High Expense Ratio 0.37 Sharpe Ratio 1.74 Information Ratio 0 Alpha Ratio 0 Min Investment 5,000 Min SIP Investment 500 Exit Load 0-6 Months (2%),6-12 Months (1%),12 Months and above(NIL) Growth of 10,000 investment over the years.
Date Value 31 May 21 ₹10,000 31 May 22 ₹10,366 31 May 23 ₹12,077 31 May 24 ₹14,248 31 May 25 ₹18,529 31 May 26 ₹29,458 Returns for Invesco India Gold Fund
absolute basis & more than 1 year are on CAGR (Compound Annual Growth Rate) basis. as on 29 May 26 Duration Returns 1 Month 5.7% 3 Month -1.8% 6 Month 22.9% 1 Year 60.5% 3 Year 34.5% 5 Year 24.3% 10 Year 15 Year Since launch 10.6% Historical performance (Yearly) on absolute basis
Year Returns 2024 69.6% 2023 18.8% 2022 14.5% 2021 12.8% 2020 -5.5% 2019 27.2% 2018 21.4% 2017 6.6% 2016 1.3% 2015 21.6% Fund Manager information for Invesco India Gold Fund
Name Since Tenure Abhisek Bahinipati 1 Nov 25 0.49 Yr. Data below for Invesco India Gold Fund as on 30 Apr 26
Asset Allocation
Asset Class Value Cash 3.07% Other 96.93% Top Securities Holdings / Portfolio
Name Holding Value Quantity Invesco India Gold ETF
- | -98% ₹455 Cr 358,519
↑ 8,471 Triparty Repo
CBLO/Reverse Repo | -2% ₹8 Cr Net Receivables / (Payables)
CBLO | -0% -₹1 Cr
As said above, selecting a best Mutual Fund is a tedious task requiring research. You have to be careful in selecting the best mutual fund scheme, one should assess all the risks and take into consideration the many factors that go into selecting the top and best mutual fund. Investing regularly reduces the risk of volatility and gives you better returns. If one invests consistently over time it will lead to good results in the future. Always remember, it's not market timing that makes money, it's the time you spend in the market!
All efforts have been made to ensure the information provided here is accurate. However, no guarantees are made regarding correctness of data. Please verify with scheme information document before making any investment.


AMFI Registration No. 112358 | CIN: U74999MH2016PTC282153
Shepard Technologies Pvt. Ltd. (with ARN code 112358) makes no warranties or representations, express or implied, on products offered through the platform. It accepts no liability for any damages or losses, however caused, in connection with the use of, or on the reliance of its product or related services. Terms and conditions of the website are applicable.
©2026 Shepard Technologies Private Limited. All Rights Reserved
Nice post, thanks